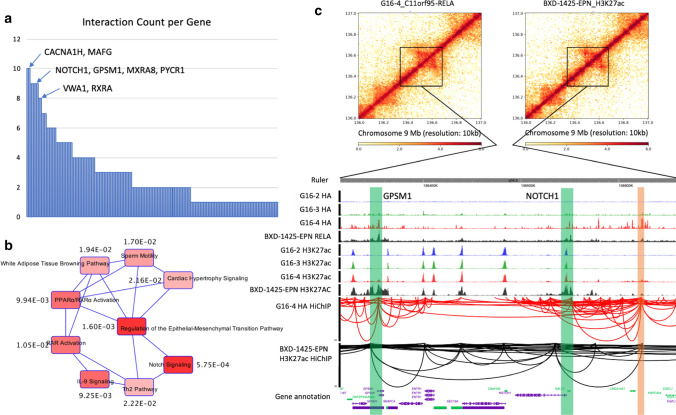
Fig. 4.
a Histogram of interaction counts per gene. The interactions coming out from the 156 identified gene promoters were counted. b Canonical pathway analysis of 102 genes that had more than one interaction. The numbers by the pathways are p values. c Chromatin interactions captured by HiChIP along NOTCH1 and GPSM1 genes. The heatmaps showed a 1 Mb region of interactions along NOTCH1 and GPSM1 genes. The browser view showed the zoom-in details of the black box indicating region in the heatmaps, including ChIP-seq profiles and HiChIP interactions. The green bars indicate NOTCH1 and GPSM1 promoters. The orange bar indicates the enhancer

