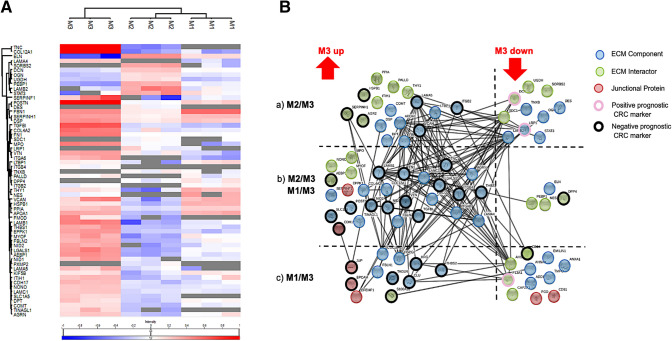
Fig. 3.
Detailed analysis of the differently regulated ECM-associated proteins in three metachronous CRLM of a single patient. 81 ECM-associated proteins were identified in the subset of regulated proteins (481). A Heat map of pearson correlation-based, hierarchical clustering of differentially regulated ECM associated proteins. Average linkage was chosen as distance metric. Protein abundances were transformed to common logarithm (log10) and the median values normalized across the columns. Mean value normalization was performed across rows for better visualization. Grey cells indicate that a protein could not be identified in the respective sample. B Modified, confidence-based STRING protein–protein interaction map. Experimental evidence, association in curated databases and co-occurrence were used as interaction sources. The minimal required interaction score was set to 0.9 (highest confidence). Proteins were grouped into three categories (ECM component, blue; ECM interactor, green; junctional protein, red) and then sorted according to the metastases between which they were identified as regulated: (a) Exclusively regulated between M2/M3; (b) regulated between M1/M3 and M2/M3; (c) exclusively regulated proteins between M1/M3. For known prognostic markers in CRC, the prognostic significance was annotated (positive prognostic marker, red circle; negative prognostic marker, black circle; unknown significance, no circle). M1, metastasis 1; M2, metastasis 2; M3, metastasis 3

