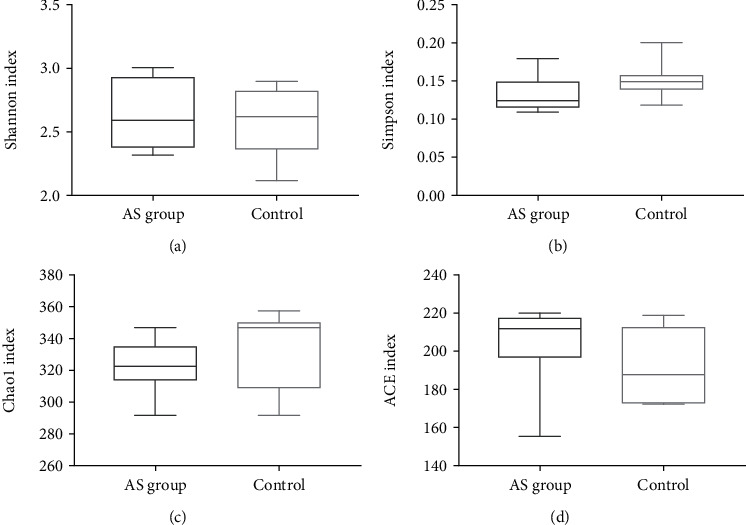
Figure 2.

The diversity indices associated with populations of bacteria present in feces. Box plots reflect microbiome diversity discrepancies between the AS cases and HCs as revealed by the Shannon index (a), Simpson index (b), Chao1 index (c), and ACE index (d).
