Figure 3.

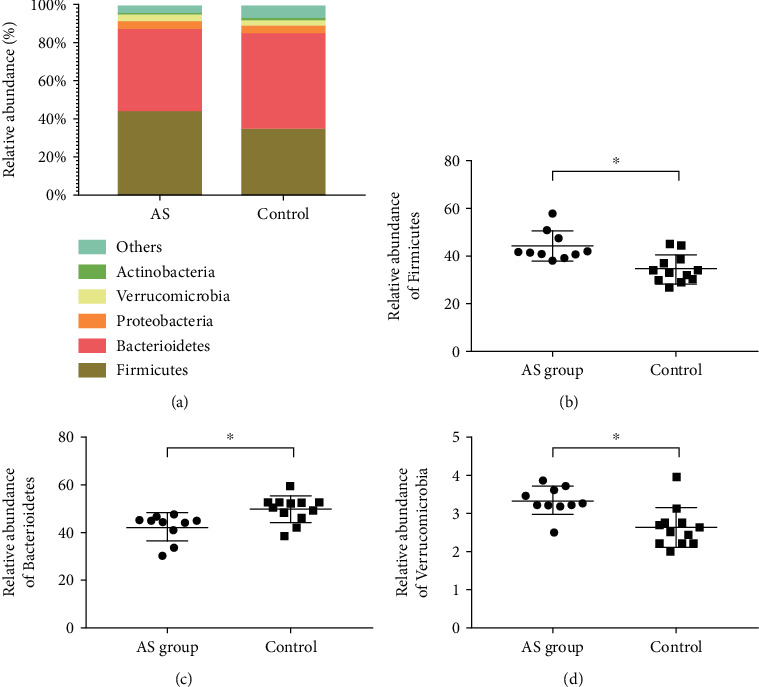
Phylum-level examination of microbiome composition. (a) The relative abundance of fecal microbes at the phylum level. Intergroup comparison of relative abundance of (b) Bacteroidetes, (c) Firmicutes, and (d) Verrucomicrobia. ∗P < 0.05.

Phylum-level examination of microbiome composition. (a) The relative abundance of fecal microbes at the phylum level. Intergroup comparison of relative abundance of (b) Bacteroidetes, (c) Firmicutes, and (d) Verrucomicrobia. ∗P < 0.05.