Figure 3.

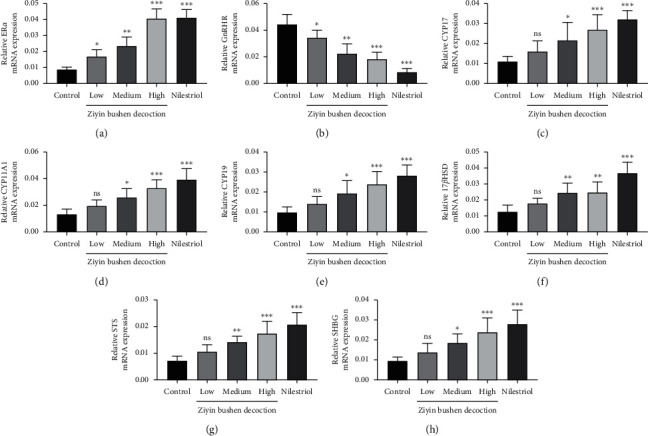
The Q-PCR results of ERα (a), GnRHR (b), CYP17 (c), CYP11A1 (d), CYP19 (e), 17βHSD (f), STS (g), and SHGB (h) in ovarian tissue. ∗p < 0.05, ∗∗p < 0.01, and ∗∗∗p < 0.001, compared with the control group; ns, no significant difference.

The Q-PCR results of ERα (a), GnRHR (b), CYP17 (c), CYP11A1 (d), CYP19 (e), 17βHSD (f), STS (g), and SHGB (h) in ovarian tissue. ∗p < 0.05, ∗∗p < 0.01, and ∗∗∗p < 0.001, compared with the control group; ns, no significant difference.