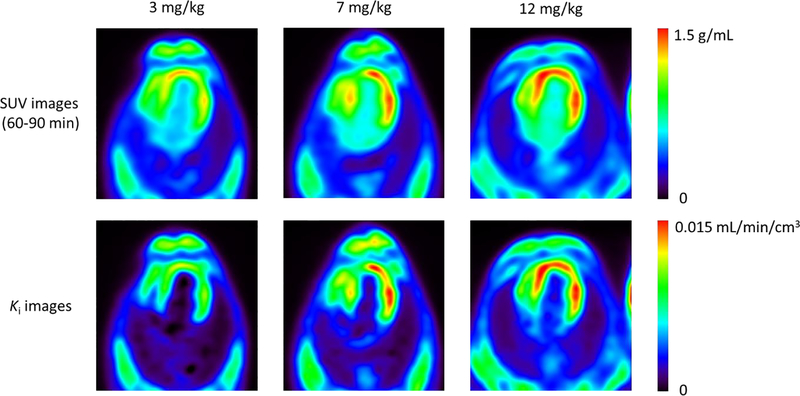
Figure 8.
Representative serial SUV and Ki parametric images at the cumulative DOX doses of 3, 7 and 12 mg/kg for the chemotherapy treated animal, shown in the transverse plane. SUV images were obtained from PET data acquired between 60–90 mins post injection, whereas Ki images were derived from voxel-by-voxel Patlak analysis (t* = 27.5 min).

