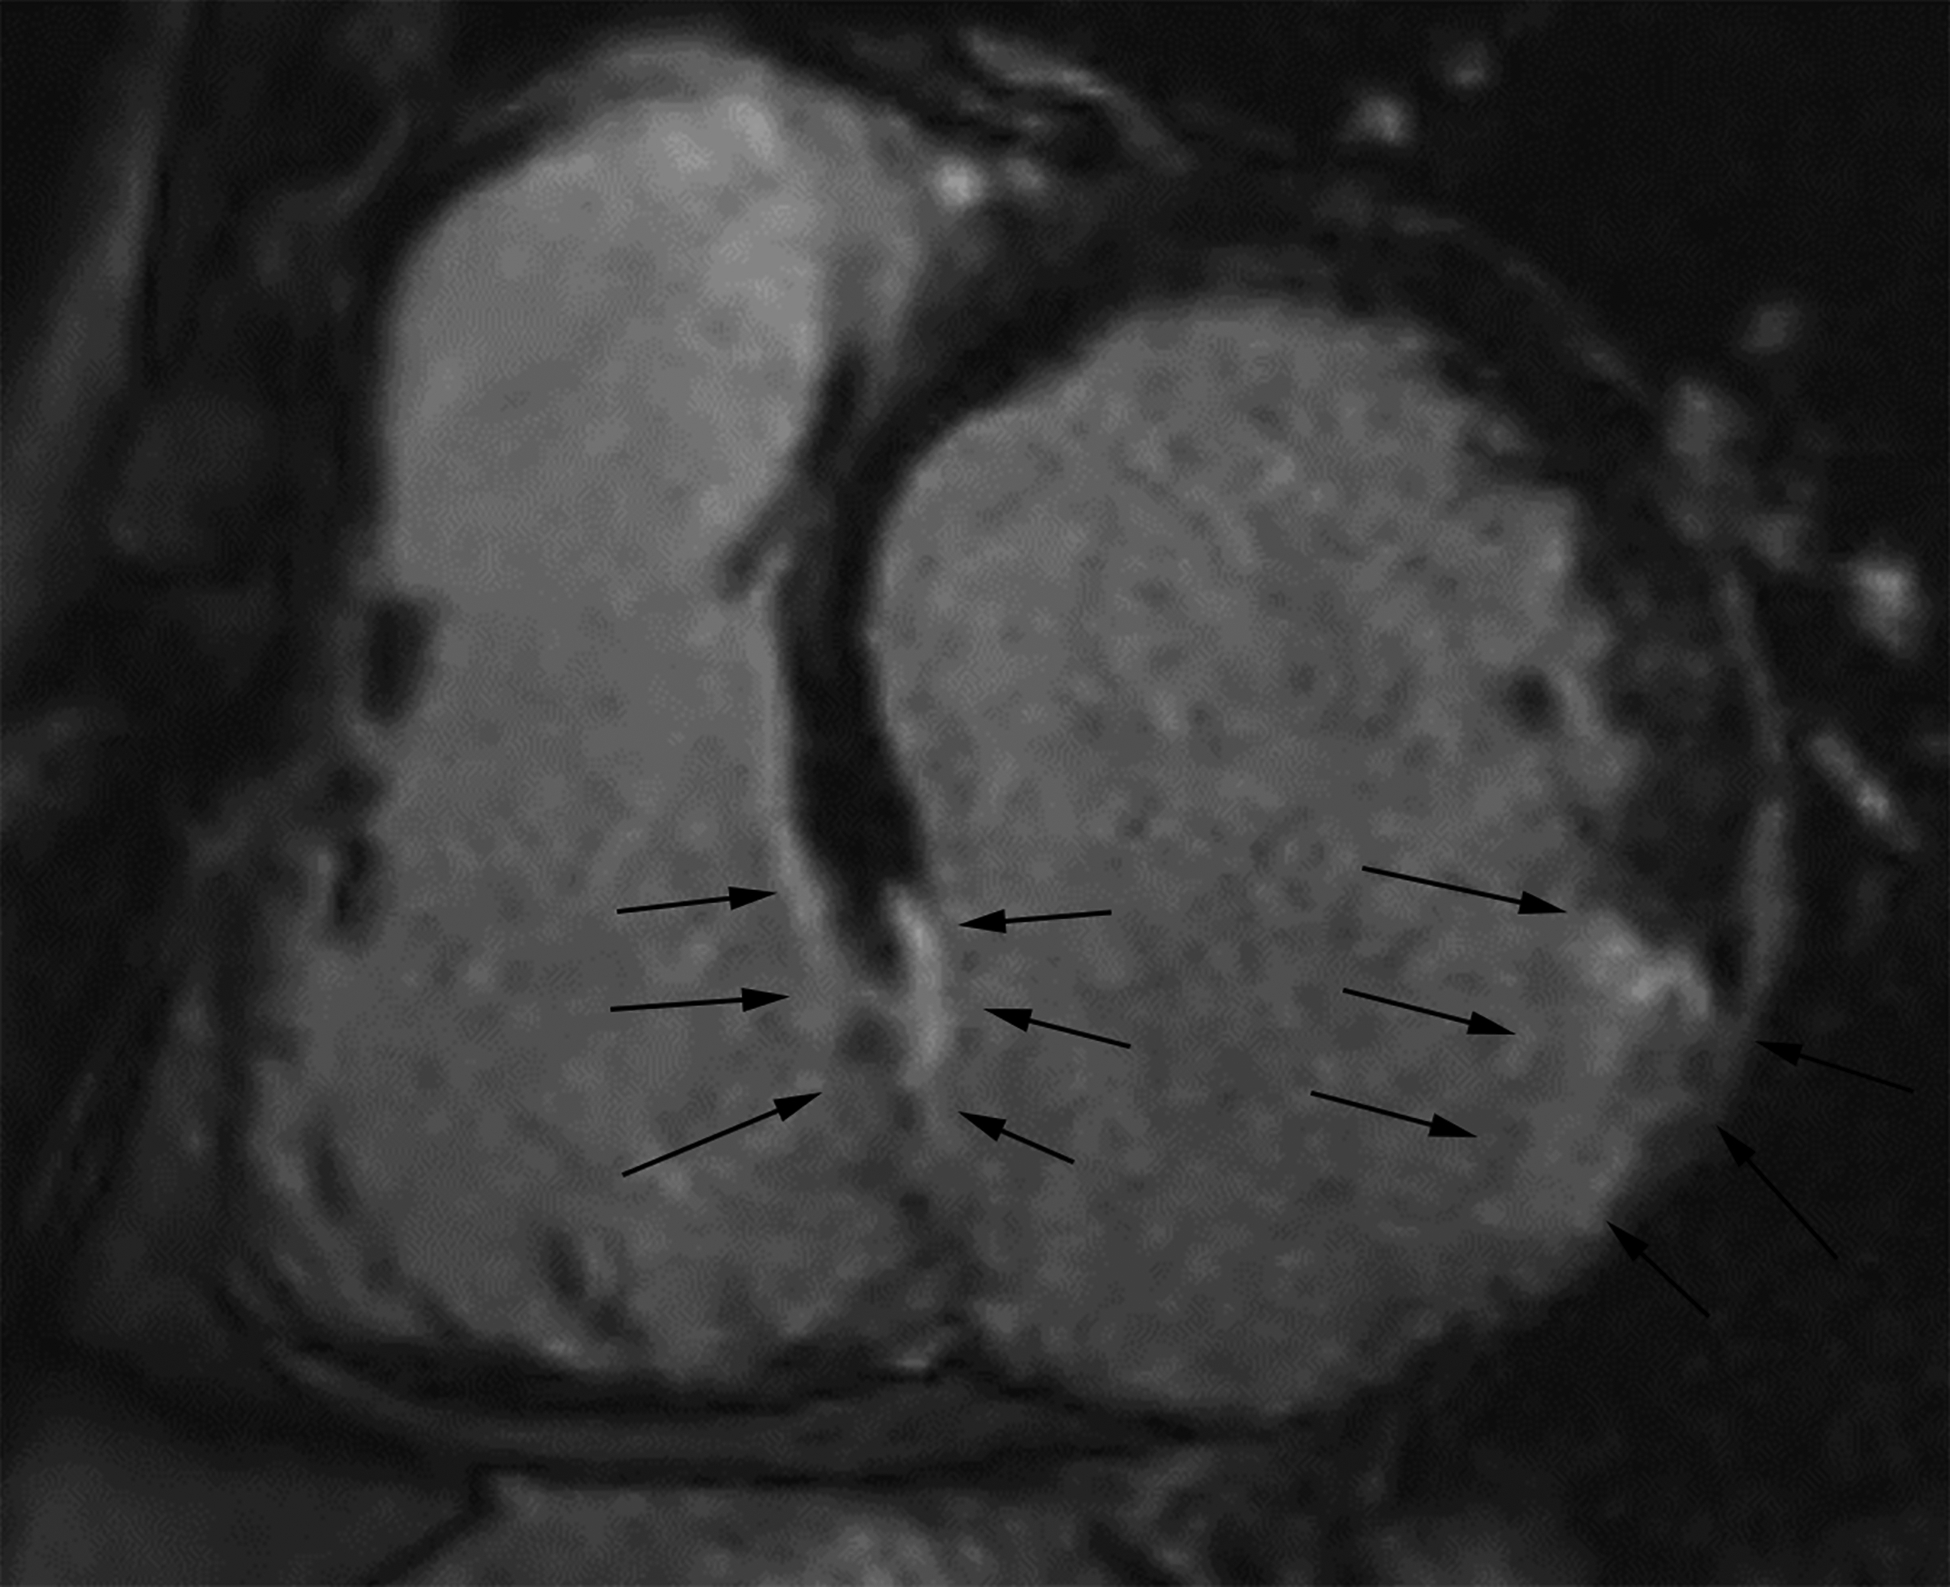
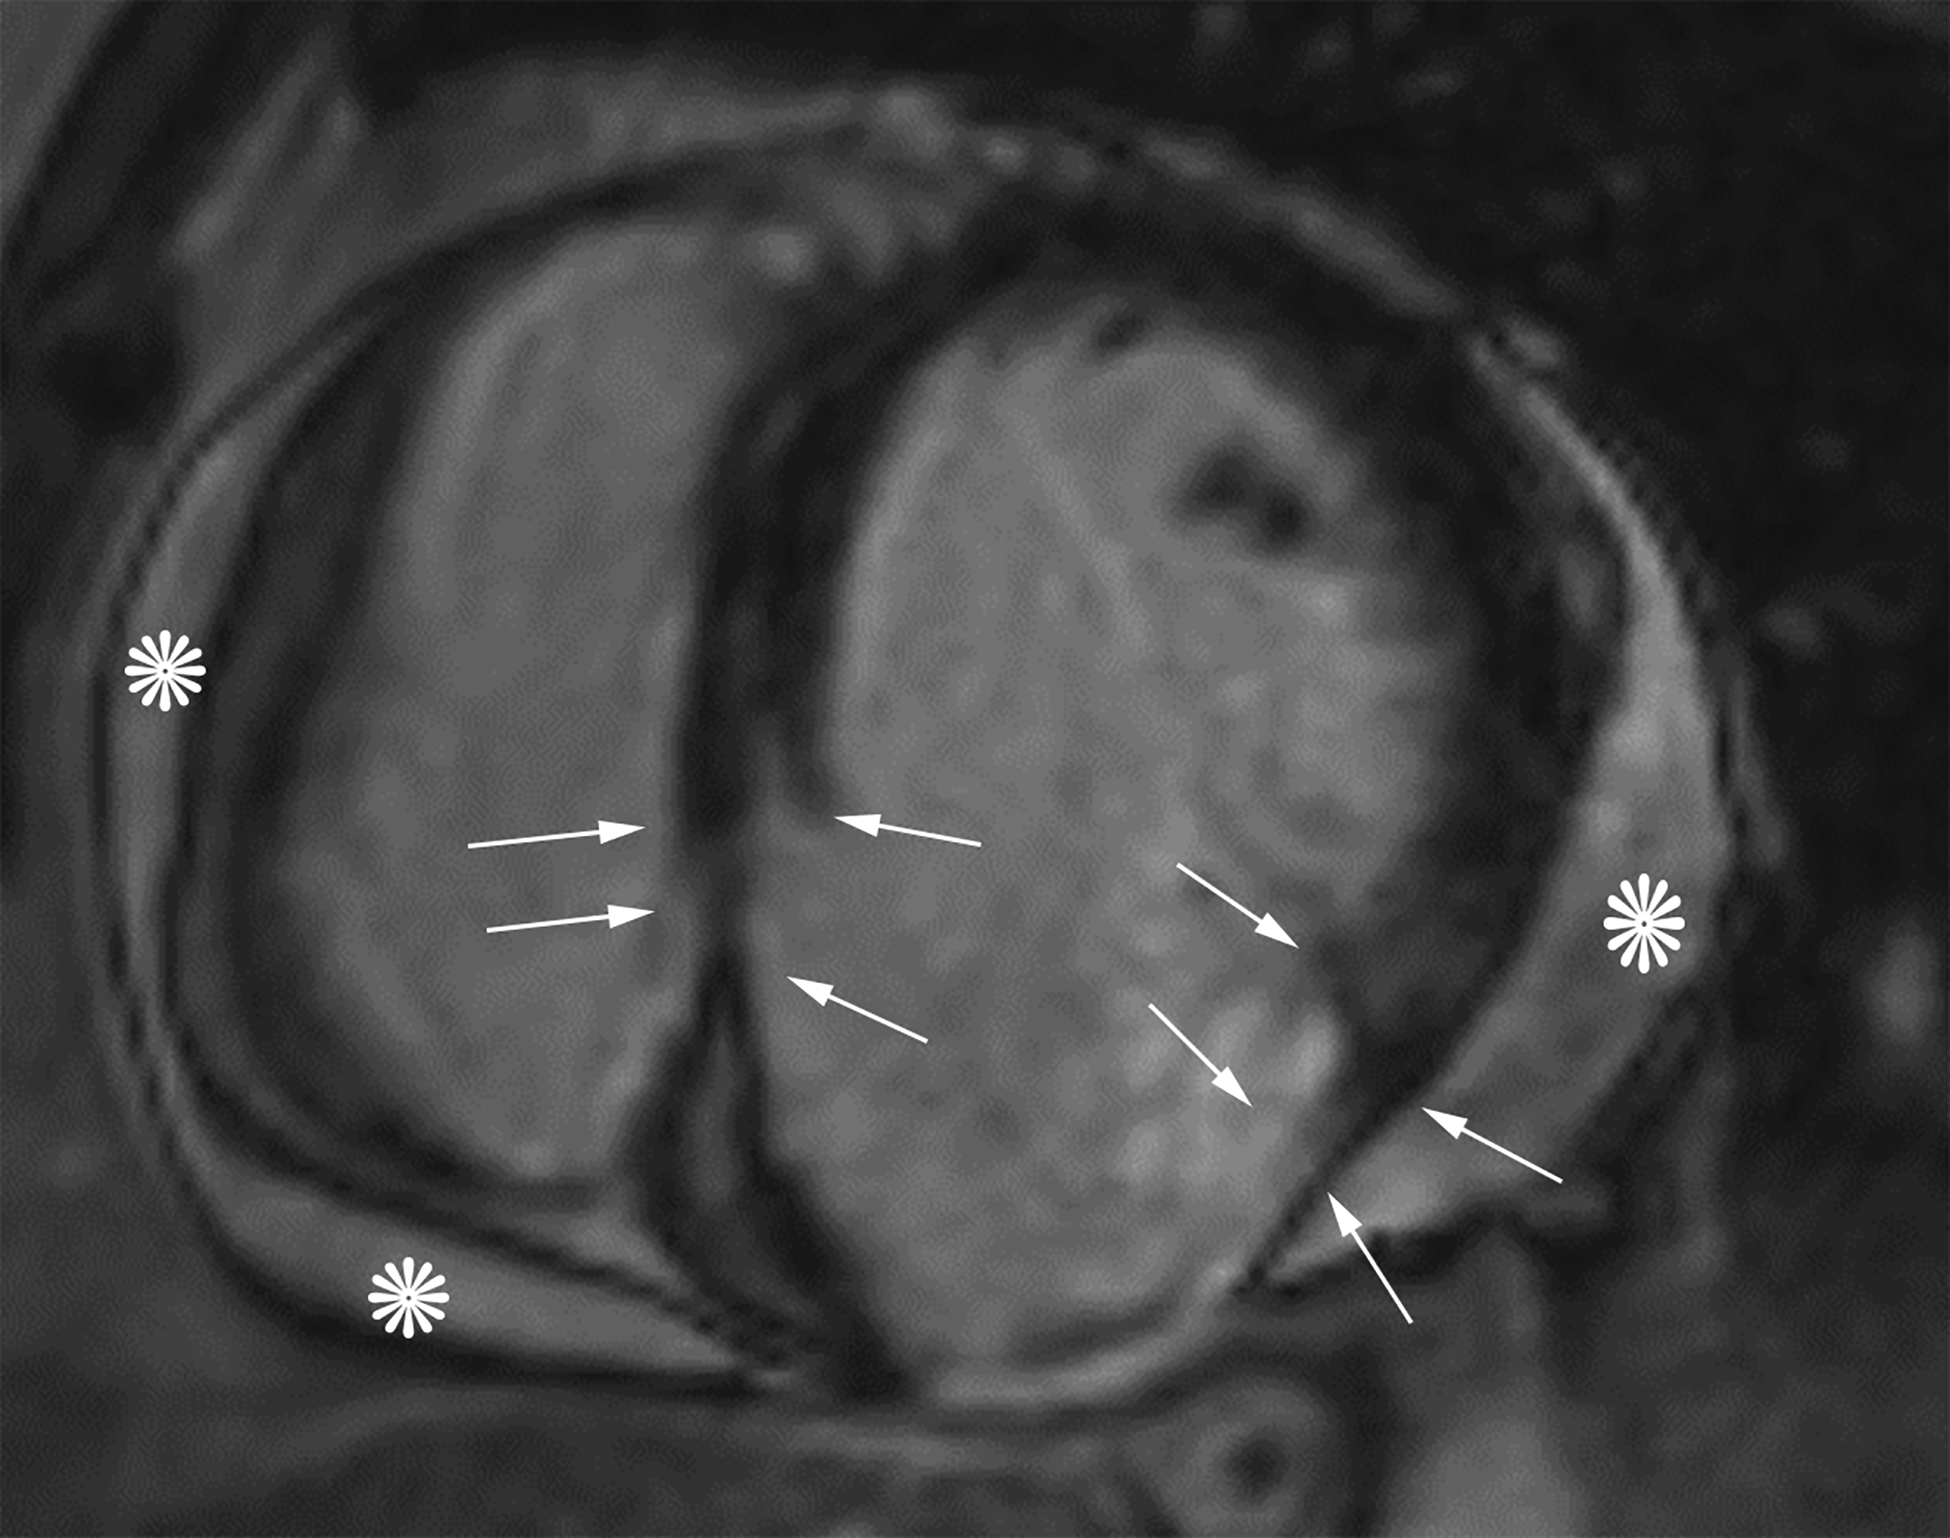
Figure 4.


Short axis delayed enhanced CMRI (a) from a patient with an inferior wall true LVA demonstrates relatively gradual tapering of the ventricular wall at the sac neck with enhancing myocardial scar tissue. Wall thickness is measured at the neck and 1 cm and 2 cm distal to the neck (black arrows). Short axis delayed enhanced CMRI (b) from a patient with an inferior wall LV PSA demonstrates relatively abrupt loss of myocardial thickness (white arrows) at the sac neck with pericardial effusion (*). If the decrease in wall thickness from the neck measurement to the sac measurement is ≥50%, then the myocardial cut-off sign is present.
