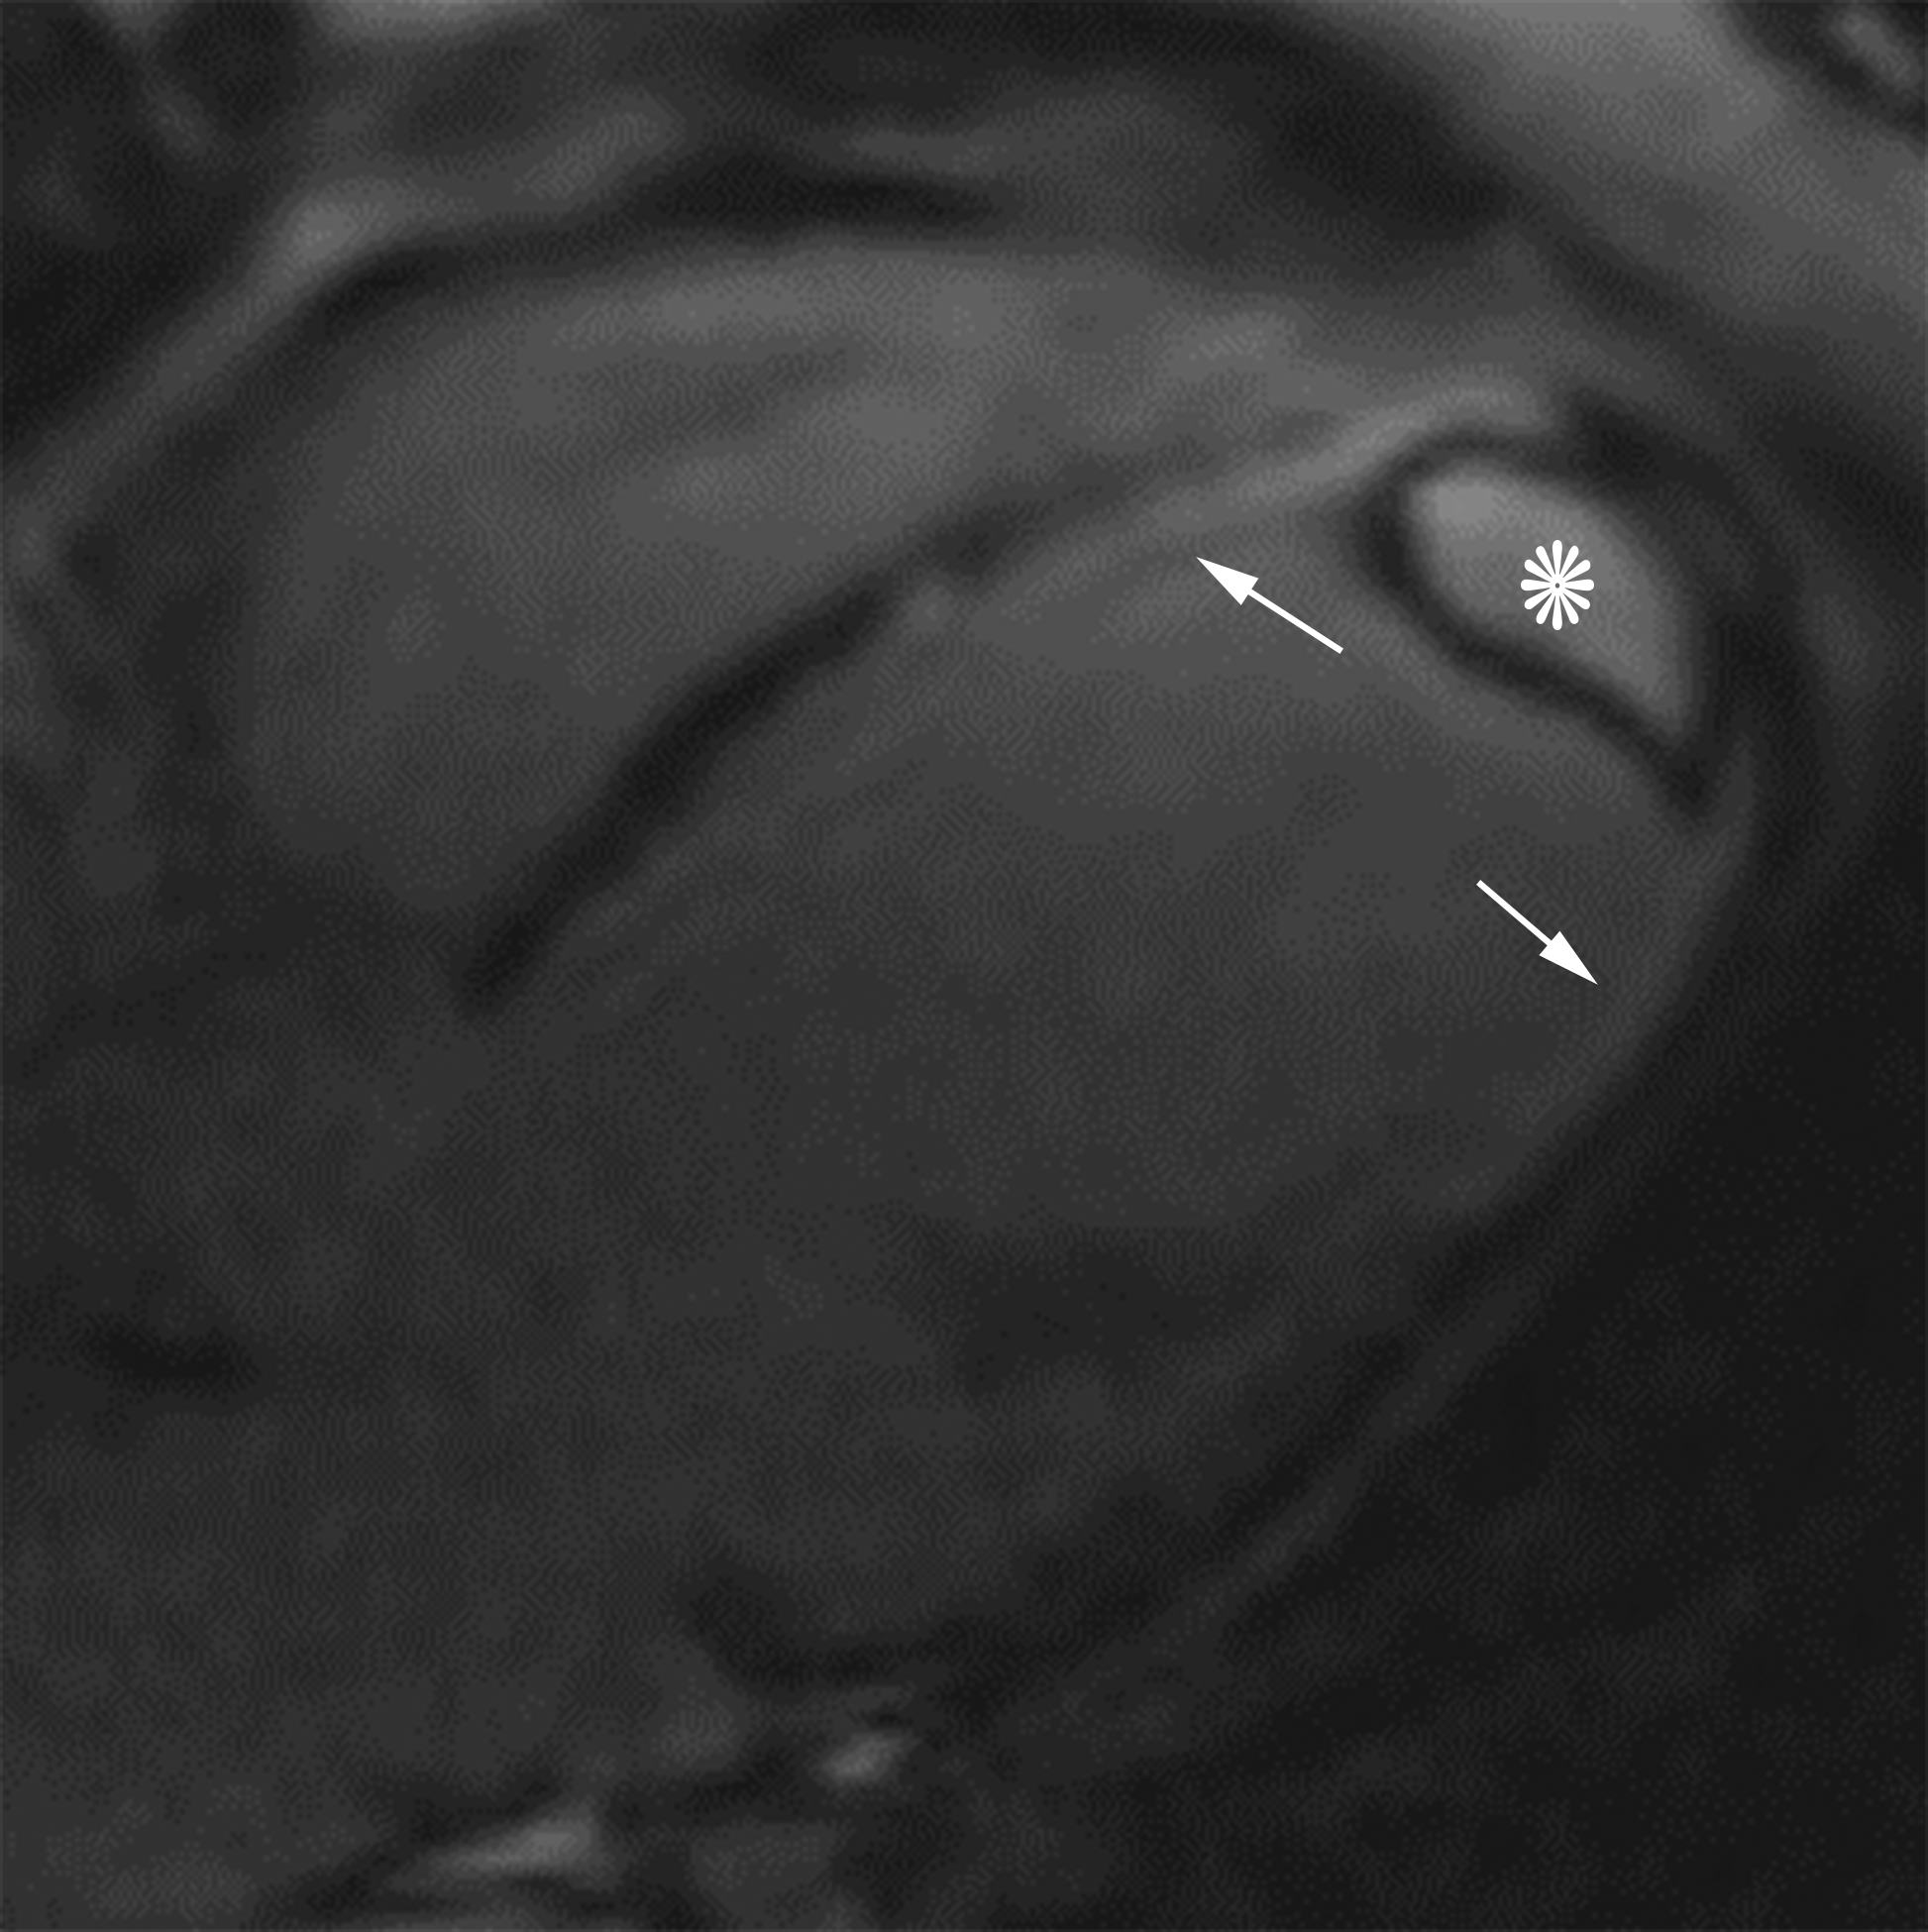
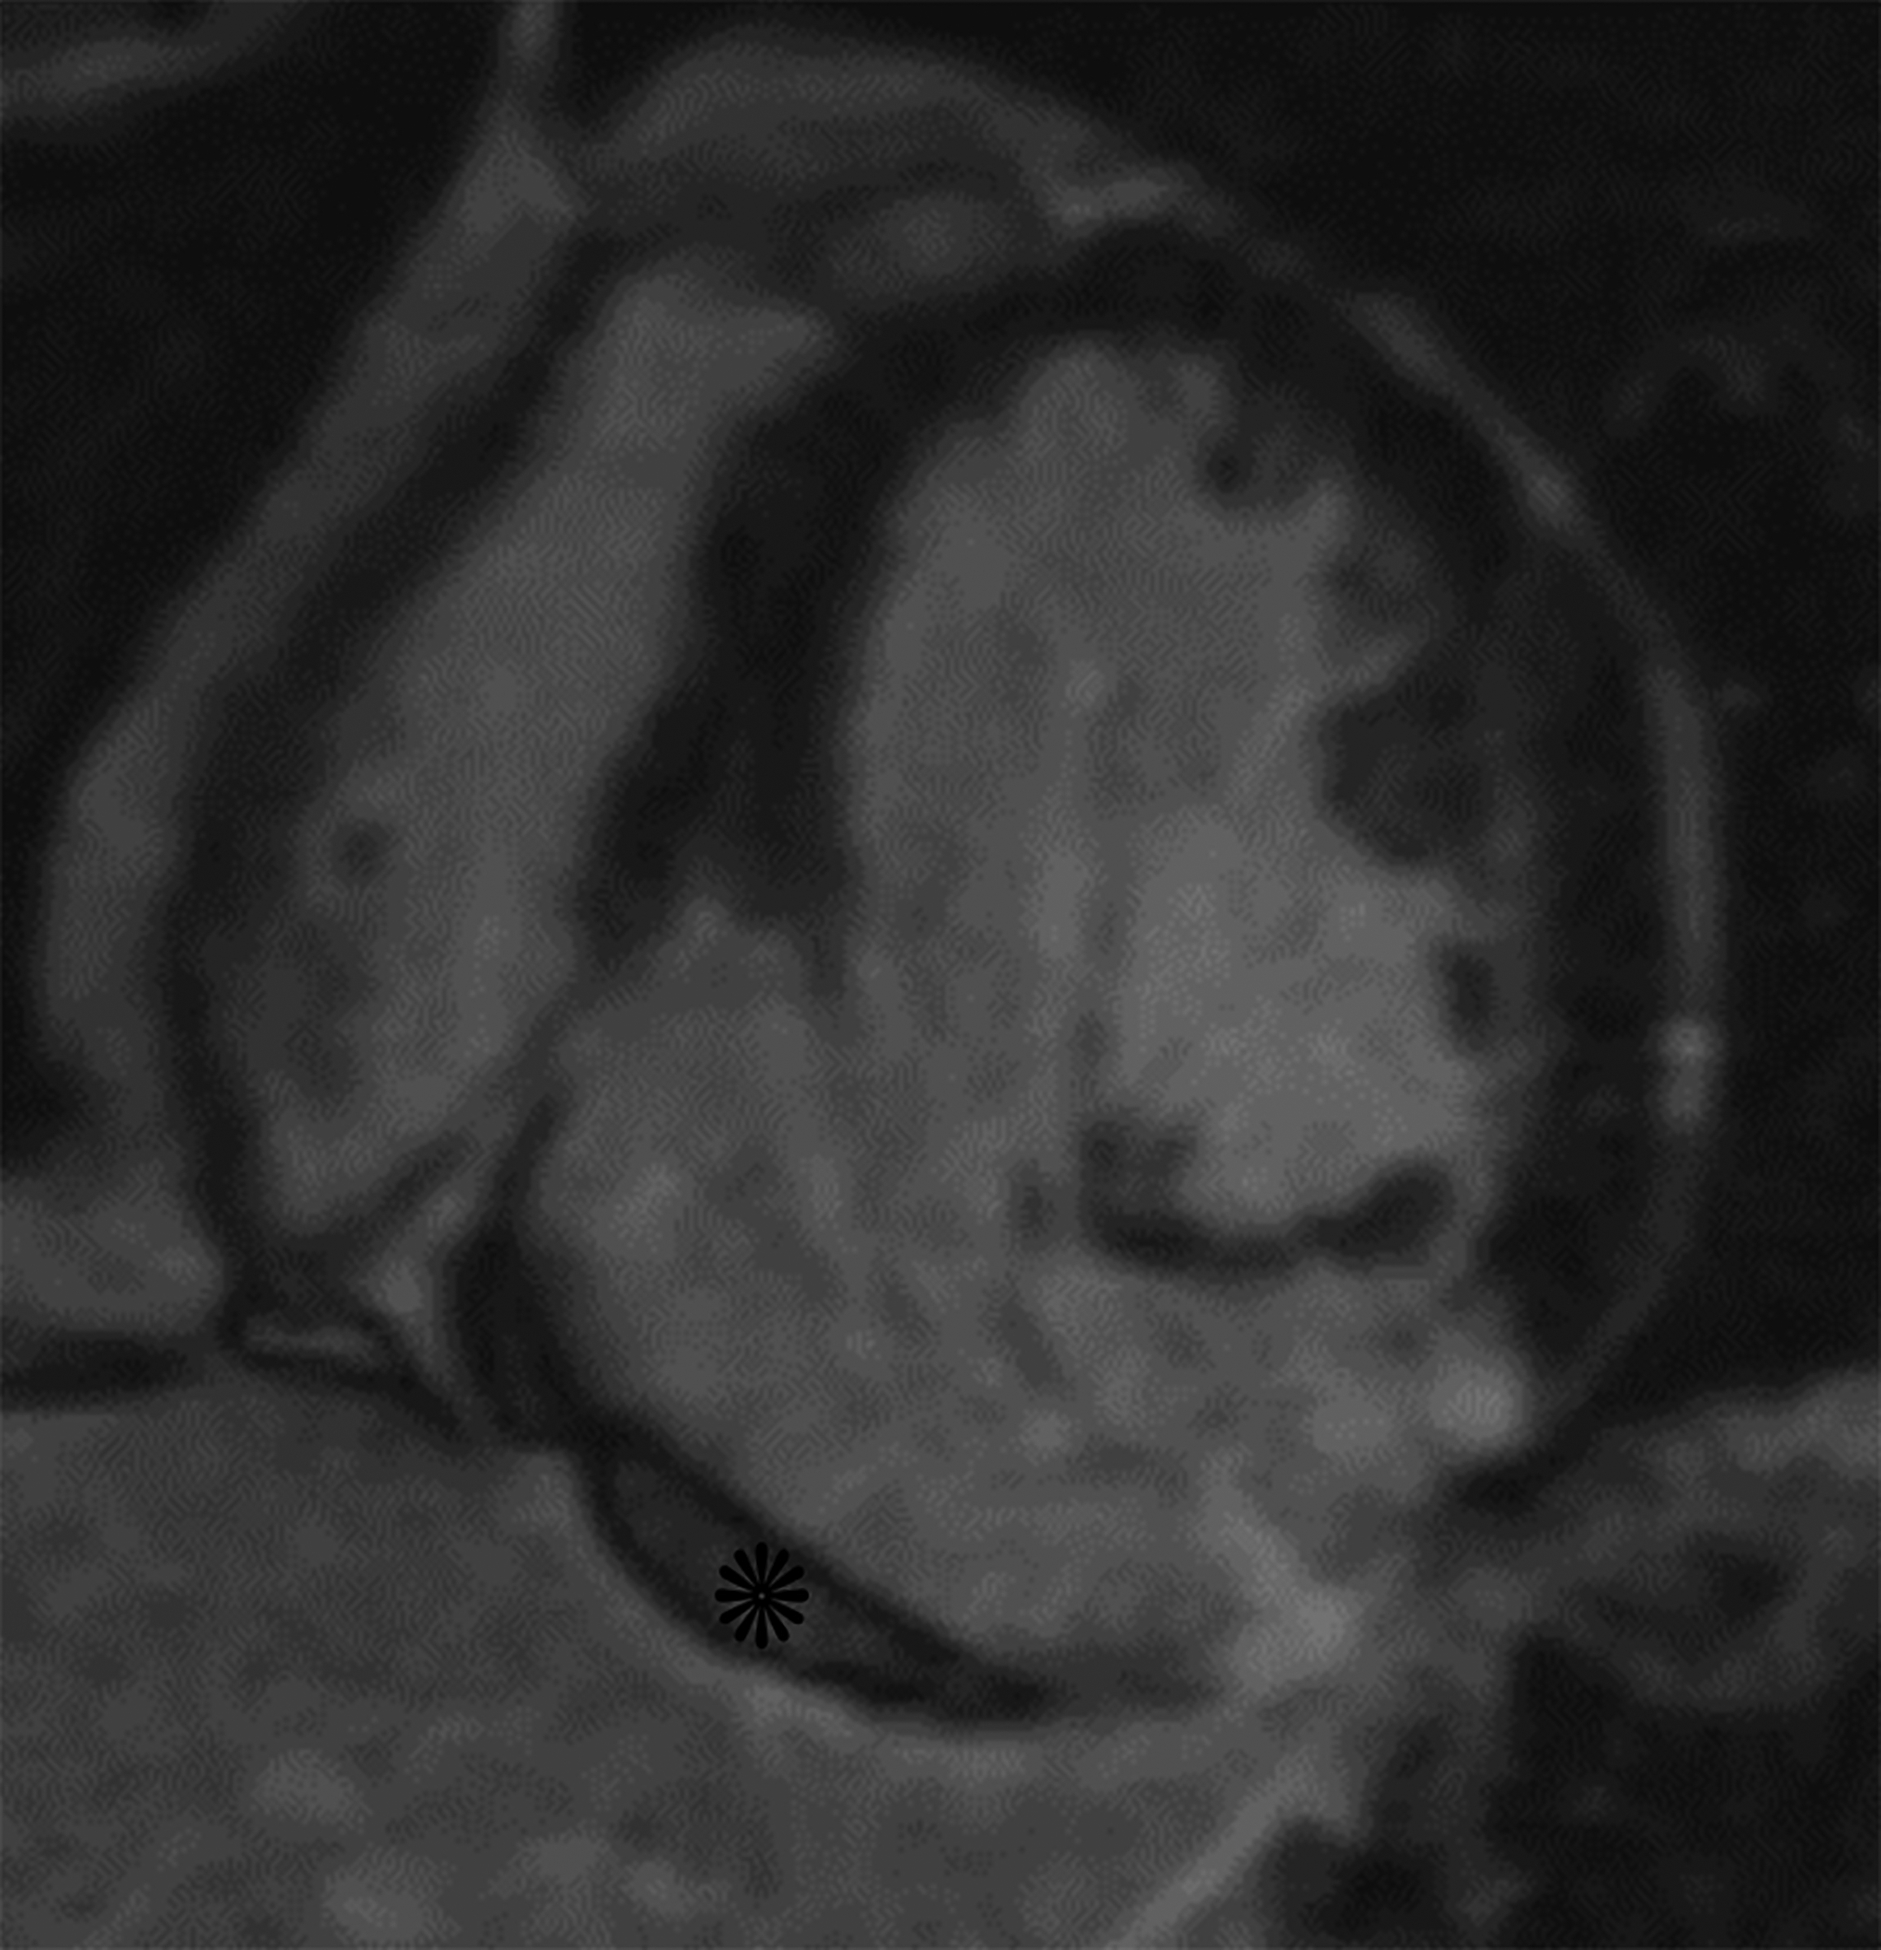
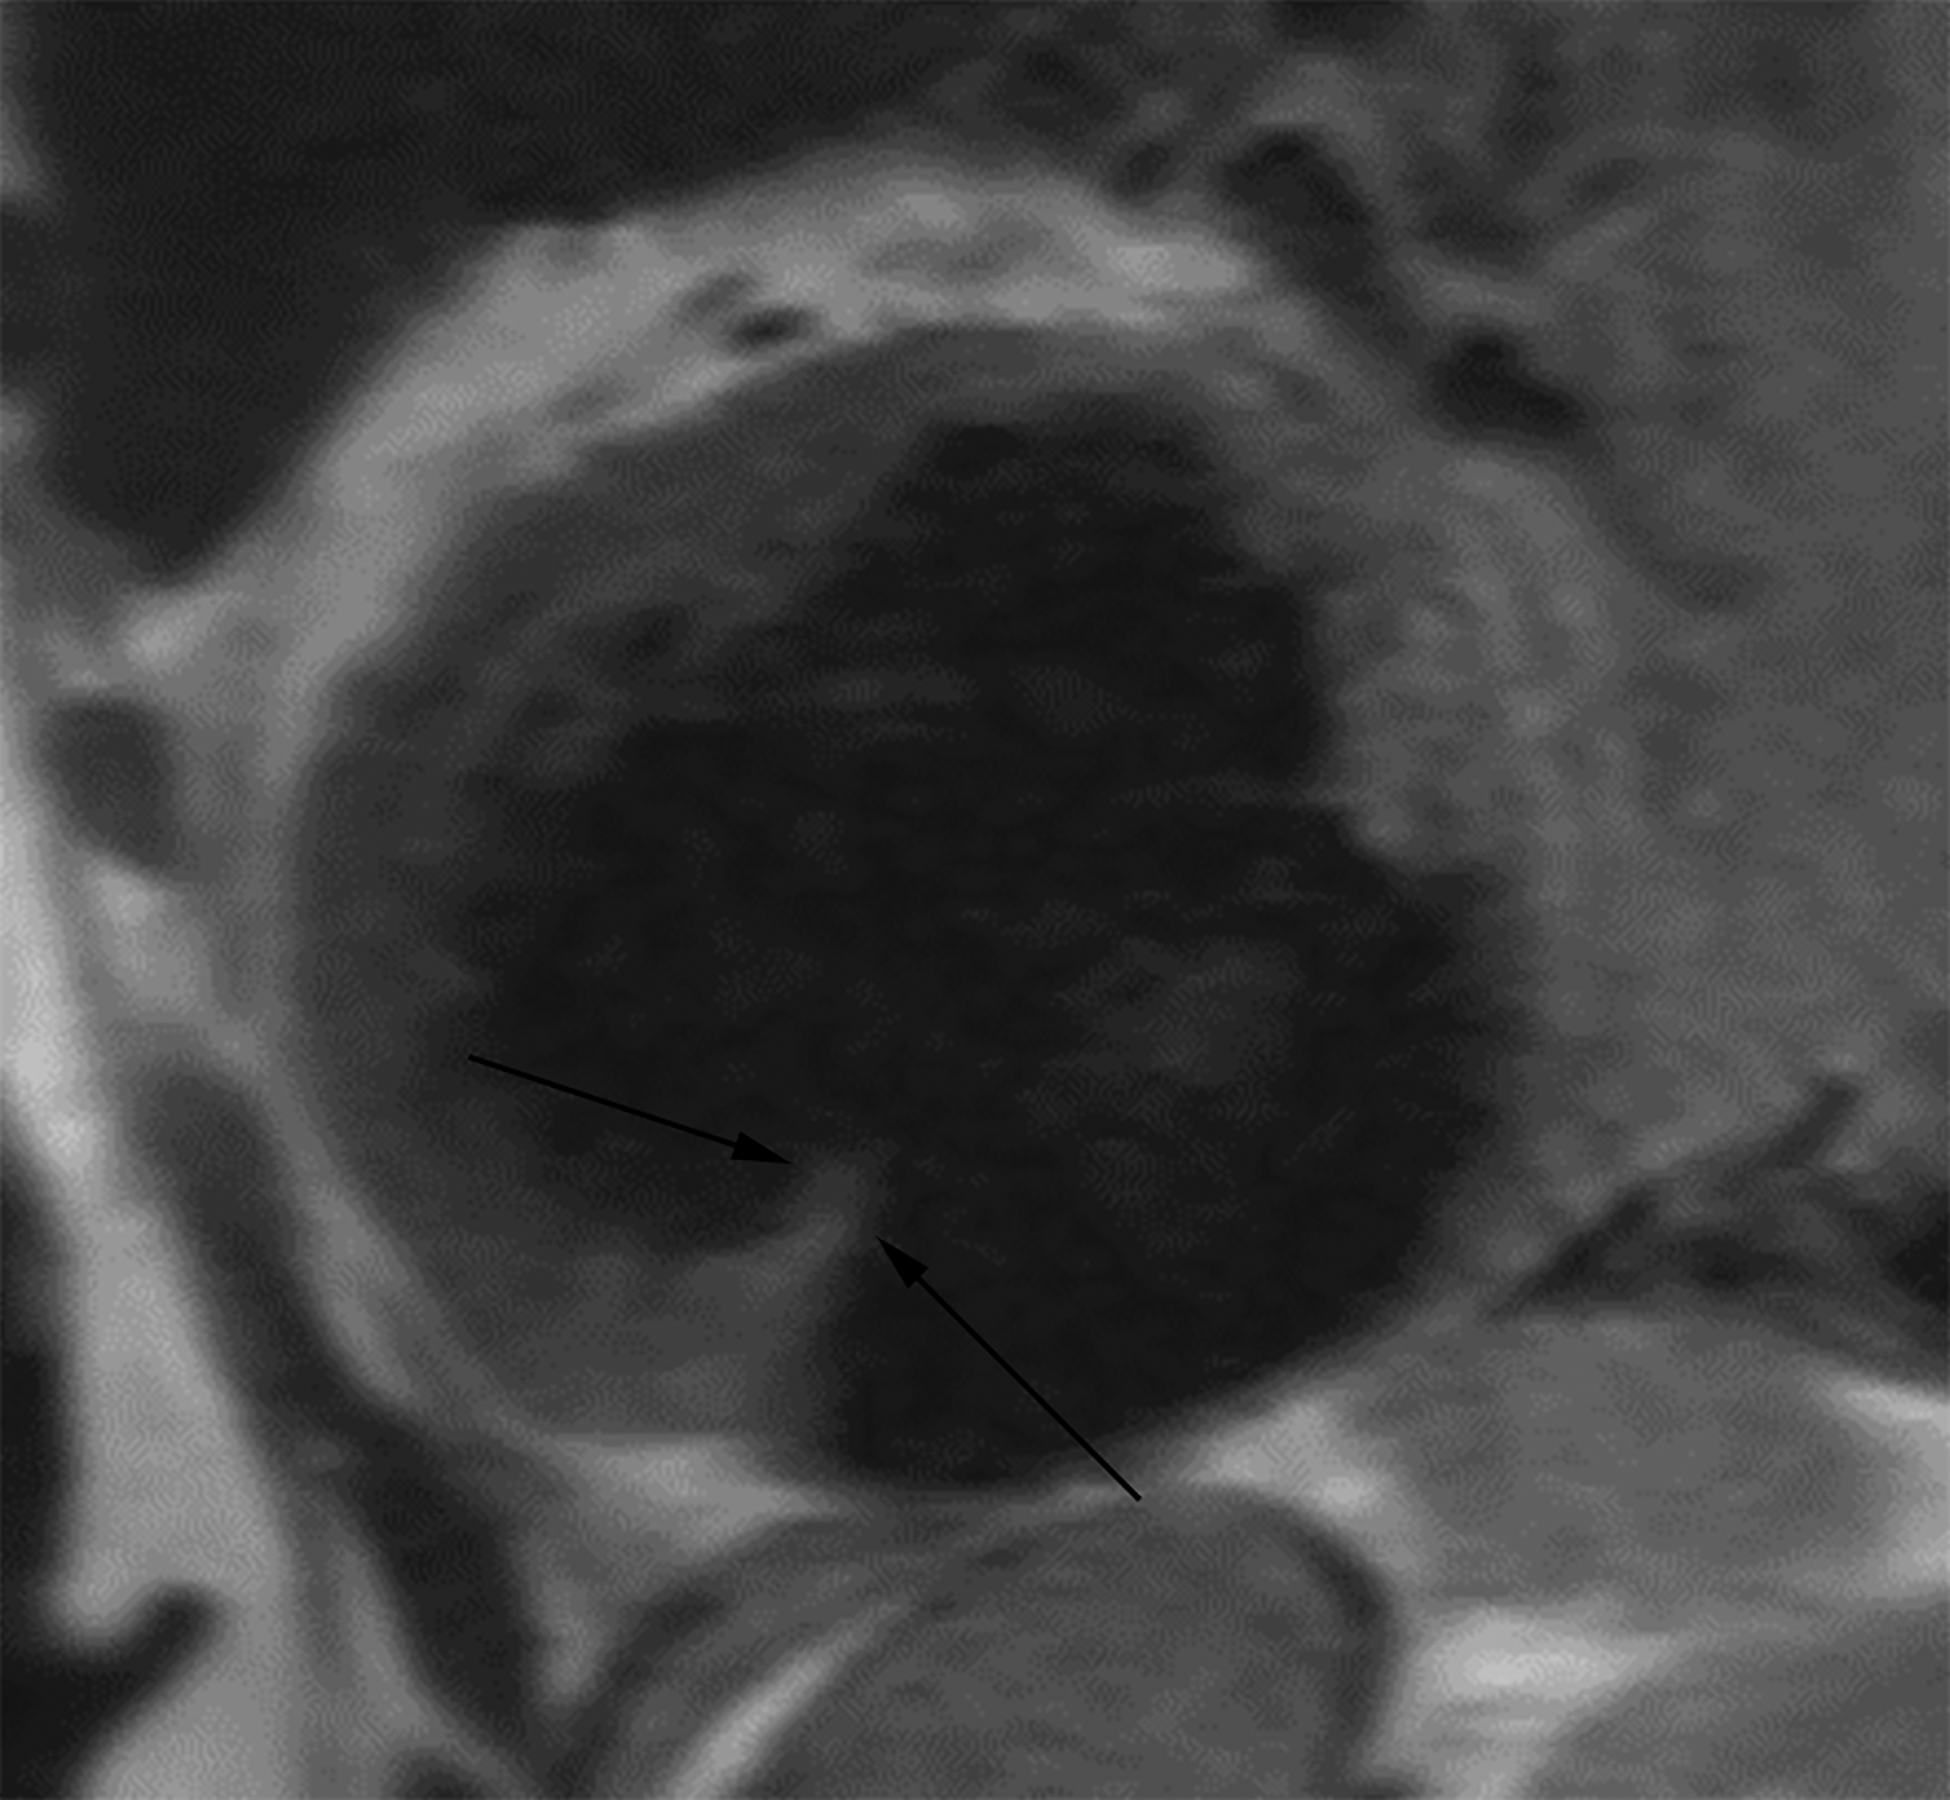
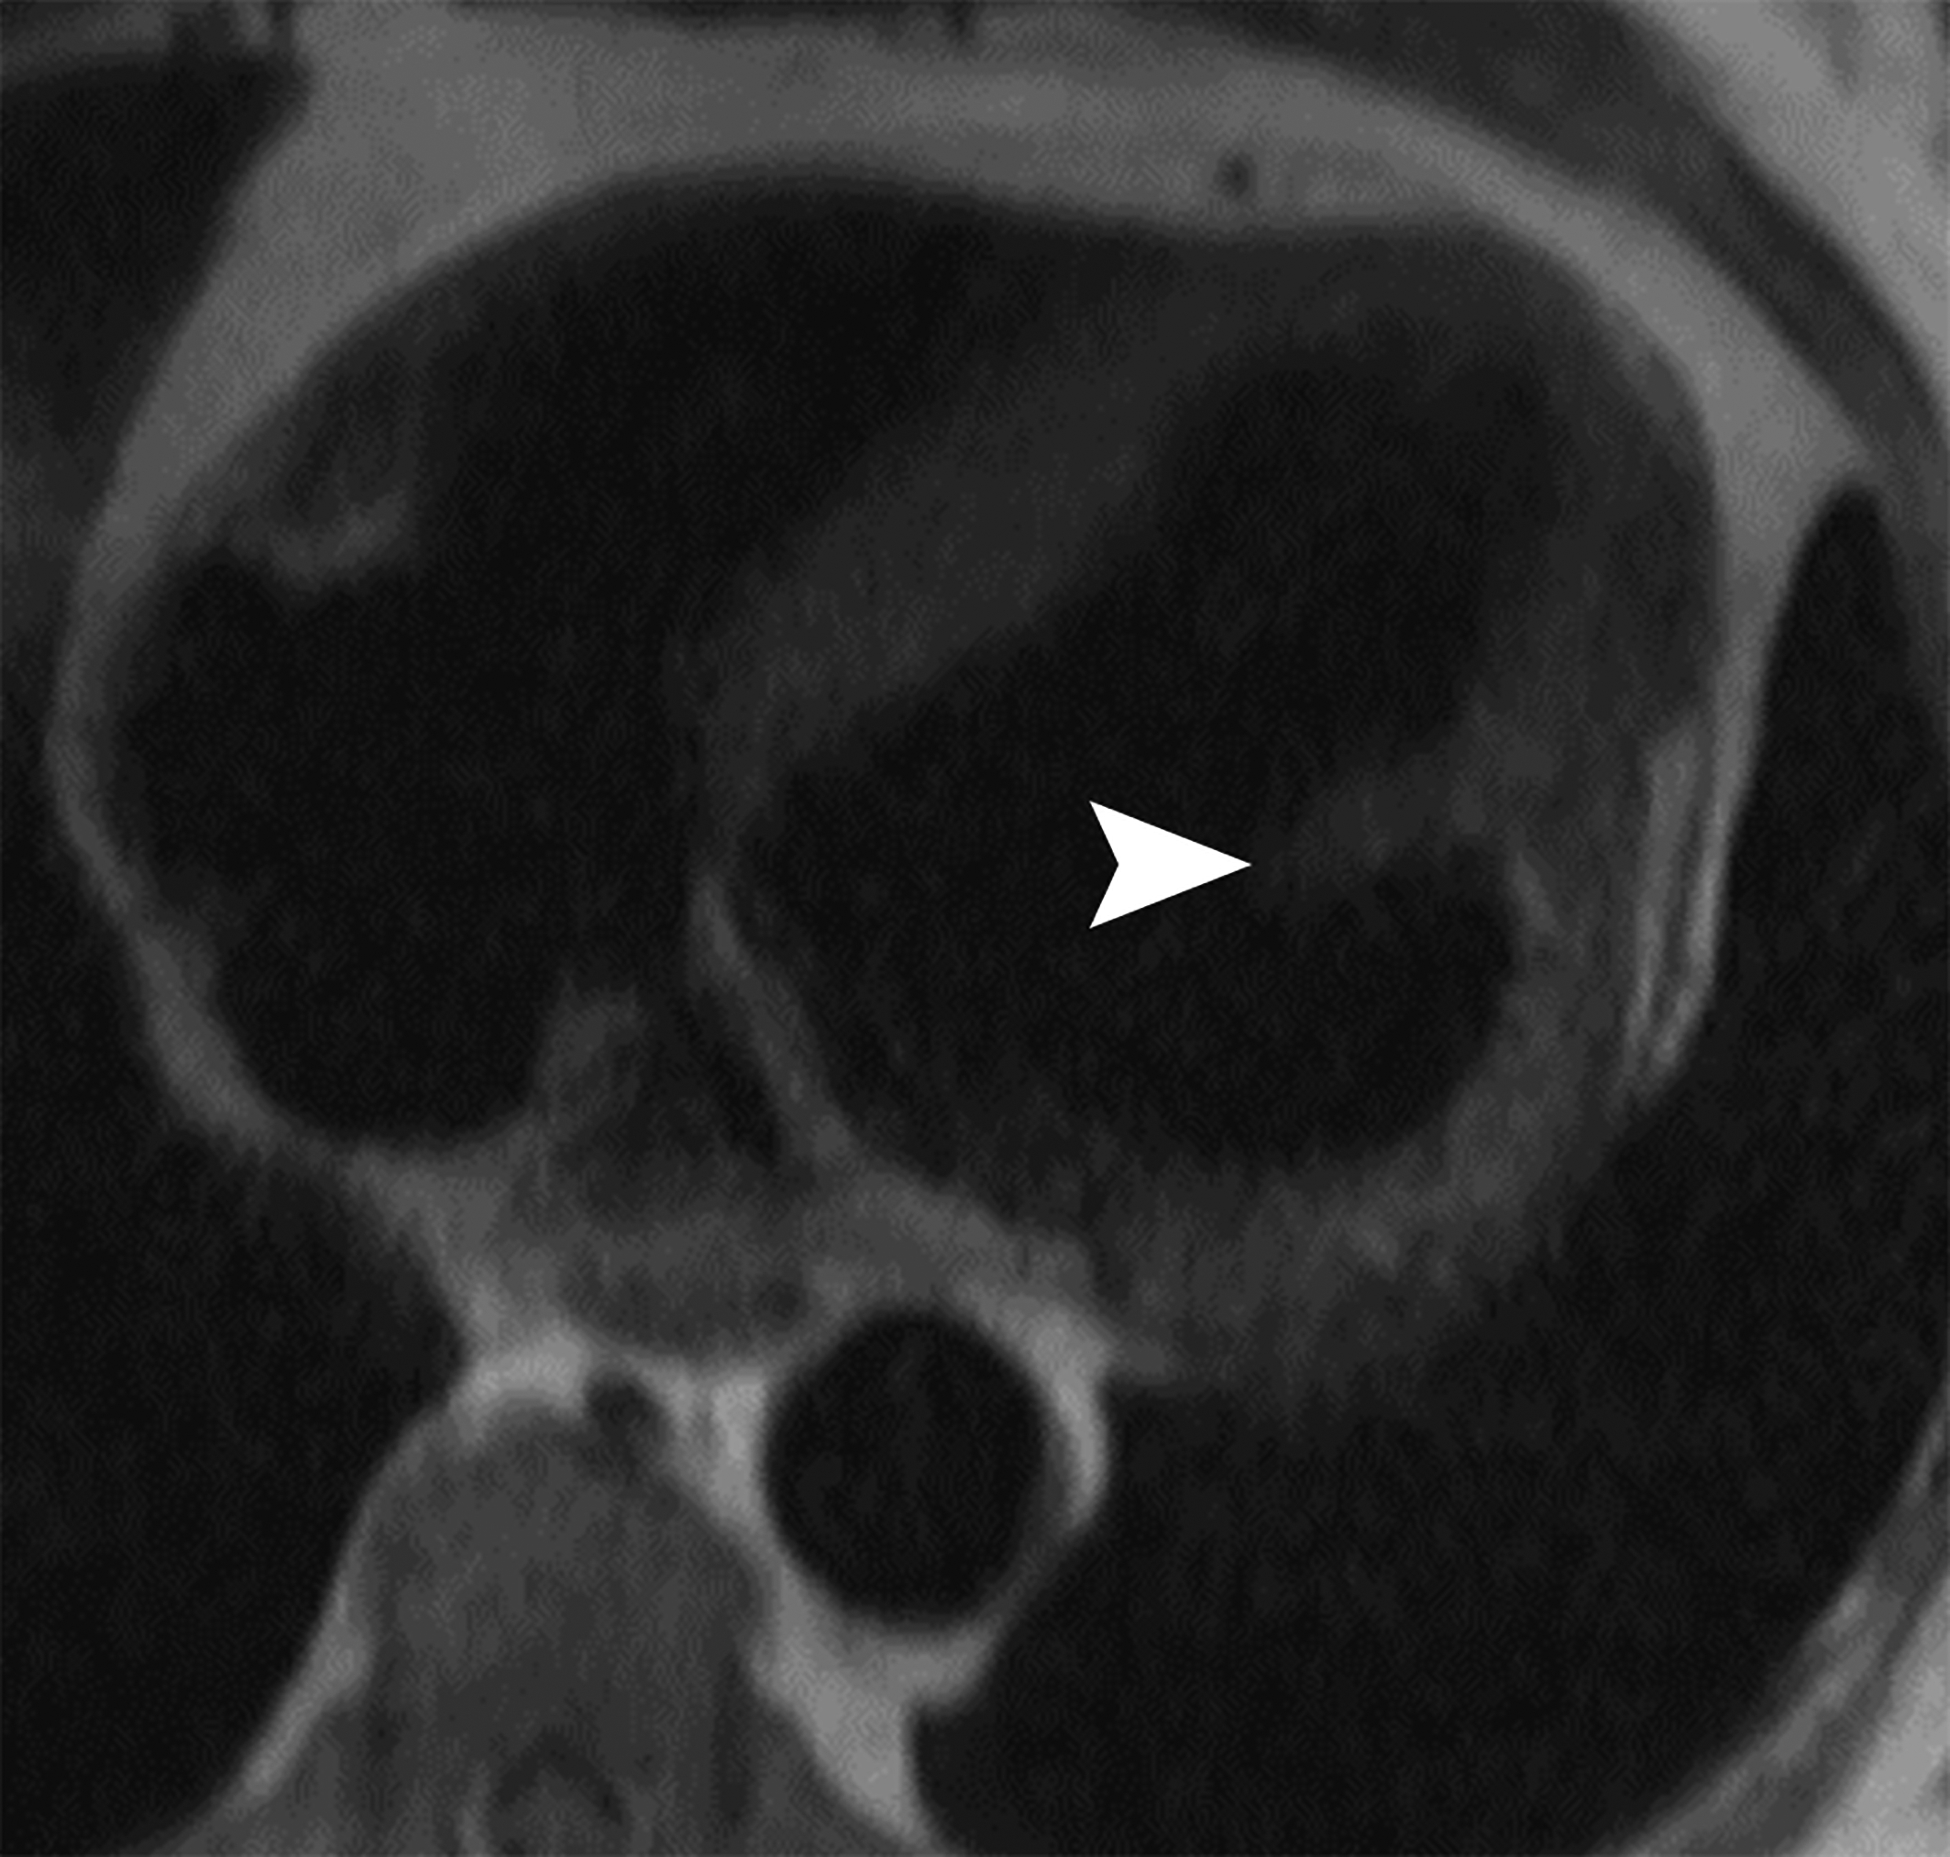
Figure 5.


Horizontal long axis (a) and short axis (b) delayed enhanced CMRI from two different patients with apical true LVA (a) and inferior basal LV PSA (b). Note the subendocardial enhancement (a, white arrows) consistent with infarct and the apical thrombus (white *). There is thrombus lining much of the sac wall in the LV PSA (b) (black *). Short axis (c) and axial (d) black blood HASTE images from two different patients with inferolateral LV PSAs. A free flap (black arrow) is seen in (c); papillary muscles can mimic a free flap (d) (arrowhead).
