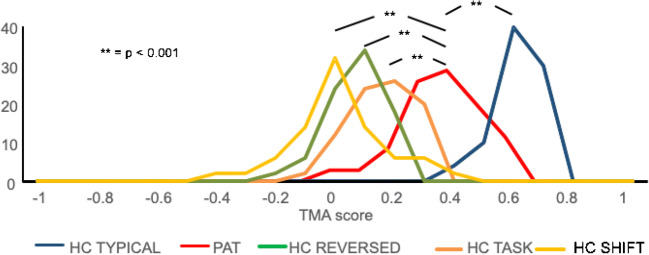
Fig. 6.
Distribution of template matching analysis (TMA) values for the verb generation (VG) template for correctly analyzed healthy controls (“TYPICAL,” blue), tumor patient data (“PAT,” red), as well as for atypical scans due to reversed orientation (“REVERSED,” green), incorrect task protocol (“TASK,” orange), or incorrect analysis with a time-shifted regressor (“SHIFT,” yellow). Patient TMA values were significantly higher than SHIFT (t(72) = 8.33; p < 0.001), TASK ((t(72) = 8.33; p < 0.001), as well as REVERSED scans ((t(72) = 8.33; p < 0.001)

