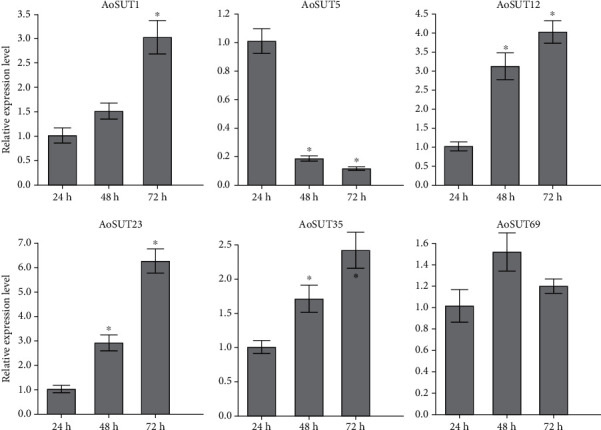
Figure 5.

Expression profiles of six selected AoSUT genes at different stages of development determined by qRT-PCR. The bars represent the average (±SE) of biological repeats. Asterisks indicate statistical difference between groups (Student's t test): ∗p < 0.05.
