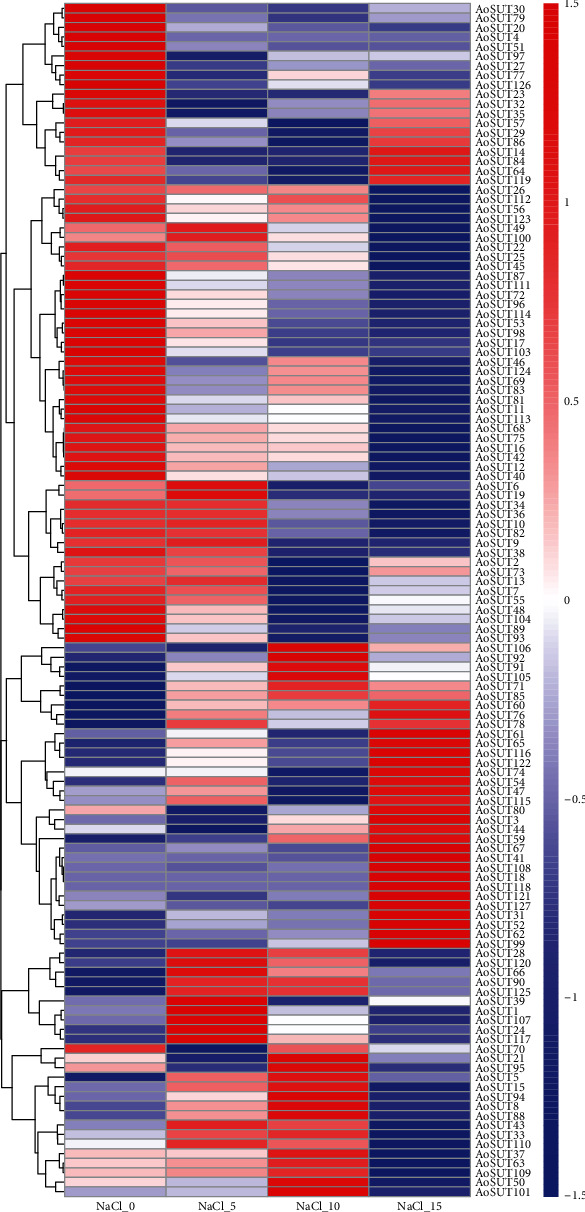
Figure 6.

The expression levels of AoSUT genes under salt stress. NaCl_0_5_10_15 indicated samples cultivated in PDA medium supplied with 0, 5, 10, and 15% NaCl, respectively. The color scale bar, ranging from blue to red, represents low and high expressions, separately.
