
Figure 2.
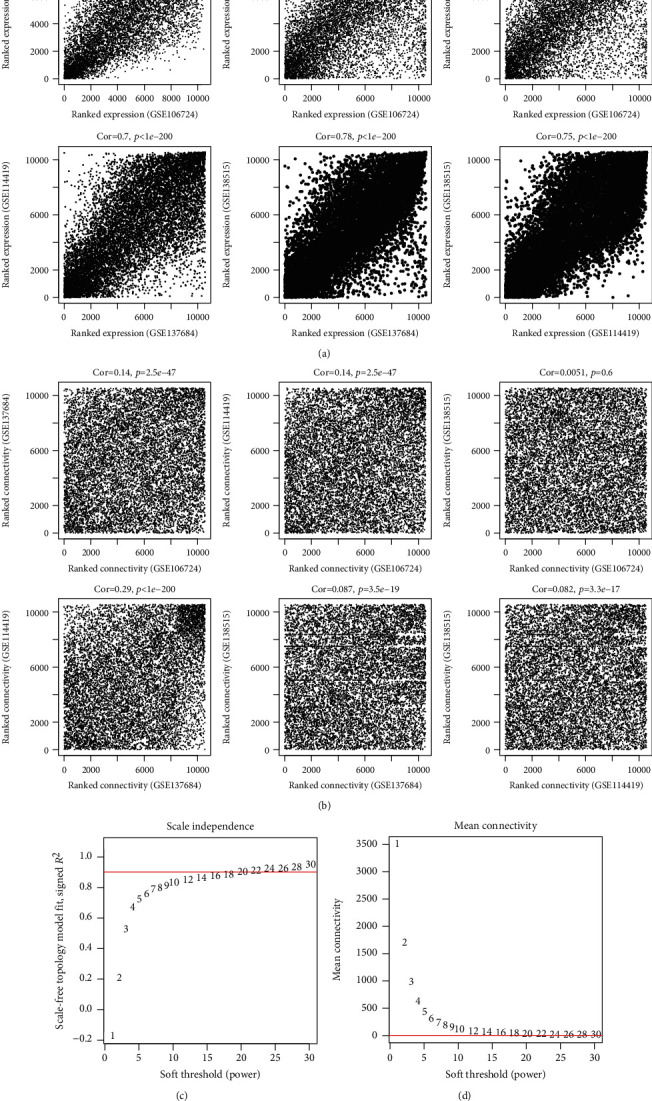
Assessment of the correlation between datasets and selection of soft threshold power β based on the training dataset. (a) The correlation of the RNA expression levels; (b) the correlation of the connectivity; (c) selection of power when the square value was equal to the red standard line (0.9) for the first time; (d) calculation of mean connectivity according to β values.