. 2020 Sep 28;9(22):8552–8561. doi: 10.1002/cam4.3483
© 2020 The Authors. Cancer Medicine published by John Wiley & Sons Ltd.
This is an open access article under the terms of the http://creativecommons.org/licenses/by/4.0/ License, which permits use, distribution and reproduction in any medium, provided the original work is properly cited.
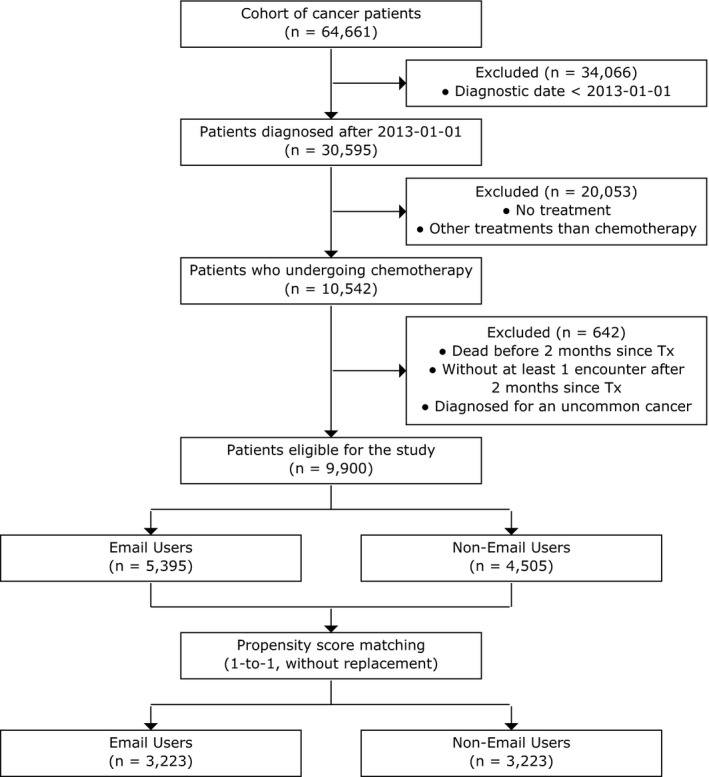
FIGURE 1.

Flowchart of study cohort, 2008–2018
