
Figure 5.
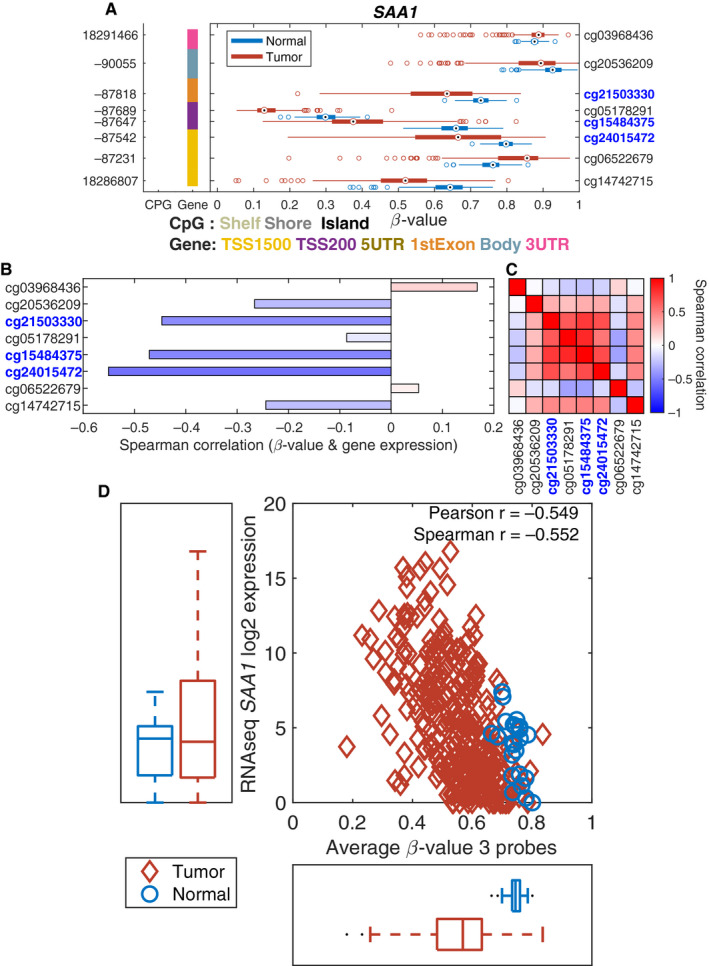
Methylation driven expression of SAA1. 5A. A box‐plot for each of the eight CpG‐probes for SAA1 comparing tumor vs normal samples. 5B. A negative correlation between the methylation and the expression level. 5C. A high degree of correlation between methylation and the expression level. 5D. Hypomethylation of these CpG sites leads to an increased expression