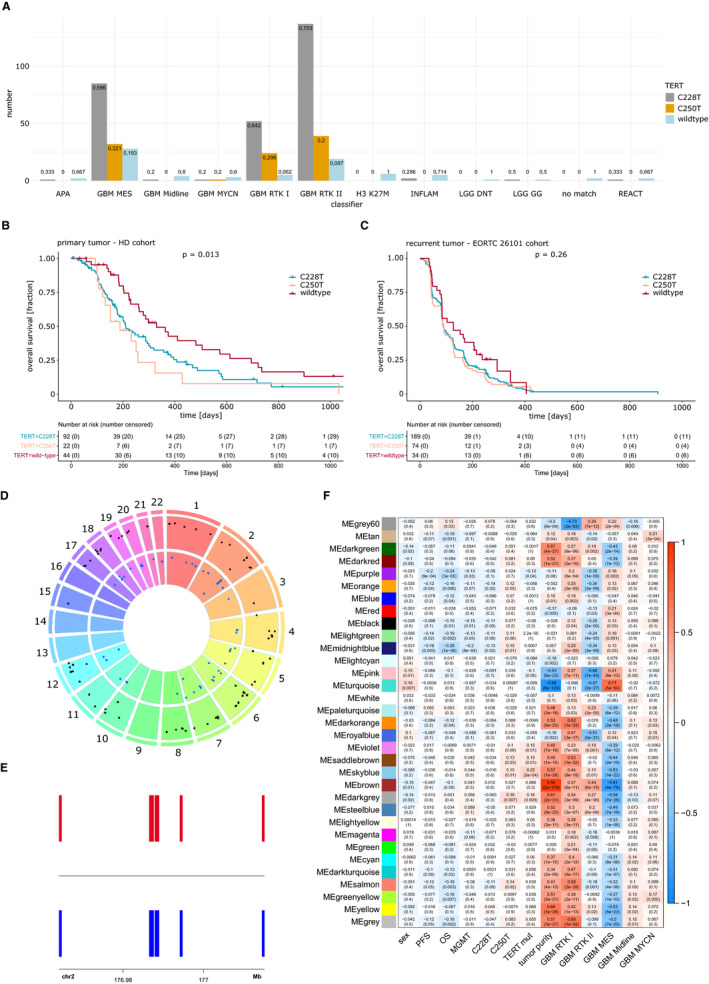
FIGURE 3.

Correlation of telomerase reverse transcriptase (TERT) status with glioblastoma subgroups. A, TERT promoter mutation status and tumor classifier subgroup. Survival analysis of patients with primary glioblastoma (B) Heidelberg cohort and recurrent glioblastoma (C) EORTC 26101 cohort. D, Visualization of genome distribution of differential methylated regions between TERT promoter mutated and wild‐type tumors. E, Differential methylated regions on chromosome 2 in C225T (upper row) and C250T (lower row) tumors. F, Heatmap of different 5'‐cytosine‐phosphat‐guanine‐3' modules as the result of the WGCNA analysis and relationship to several tumor‐specific markers. C225T, C250T, mutation location upstream of the TERT transcription start site; chr2, chromosome 2; PFS, progression‐free survival; Mb, megabase; OS, overall survival, a full list of classifier abbreviations can be found in the Supporting Information
