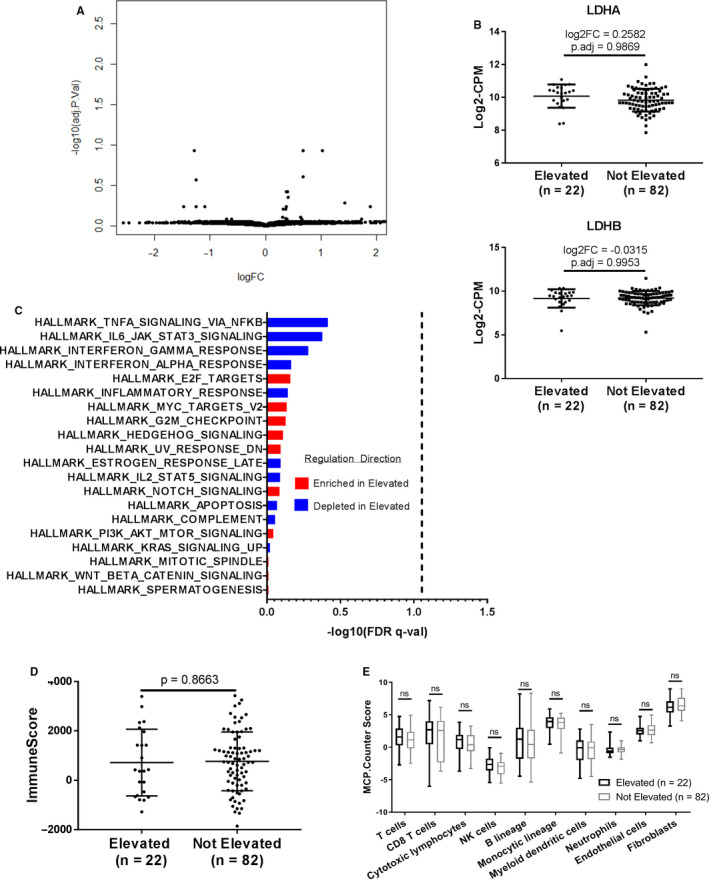
Figure 2.

Serum LDH does not associate with molecular or immune features in locoregional melanoma metastases. (A) Volcano plot of limma‐modeled gene expression data between sLDH Elevated (n = 22) and sLDH Not Elevated (n = 82) TCGA locoregional metastases. The data for all genes are plotted as log2FC vs. the −log10 of the adjusted p value. No gene met the criteria for statistical significance (│log2FC│ >1 and adj. p value <0.05). (B) Comparison of LDHA and LDHB gene expression between sLDH Elevated and sLDH Not Elevated TCGA locoregional metastases. Voom‐transformed log2‐counts per million (CPM) values of the LDHA and LDHB genes are plotted on the y‐axis. Lines represent mean ±S.D. Each dot represents a single sample. (C) Bar plot of the ‐log10(FDR q‐value) of the top 20 MSigDB Hallmarks gene sets from the comparative GSEA analysis of sLDH Elevated and sLDH Not Elevated TCGA locoregional metastases. Gene sets are ordered in descending order of their ‐log10(FDR q‐value). No gene set met the criteria for statistical significance, shown on the graph as a dashed vertical line (FDR q‐value <0.05). (D) ESTIMATE ImmuneScore analysis of sLDH Elevated vs. sLDH Not Elevated TCGA locoregional metastases. Lines represent mean ±S.D., and each dot represents a single sample. Significance determined via two‐sided Student's t test. (E) MCP‐Counter analysis of sLDH Elevated vs. sLDH Not Elevated TCGA locoregional metastases. Each plot is a simple box and whisker plot. Median values (lines) and interquartile range (whiskers) are indicated. ns: not significant (p > 0.05) by two‐sided Student's t test.
