
FIGURE 2.
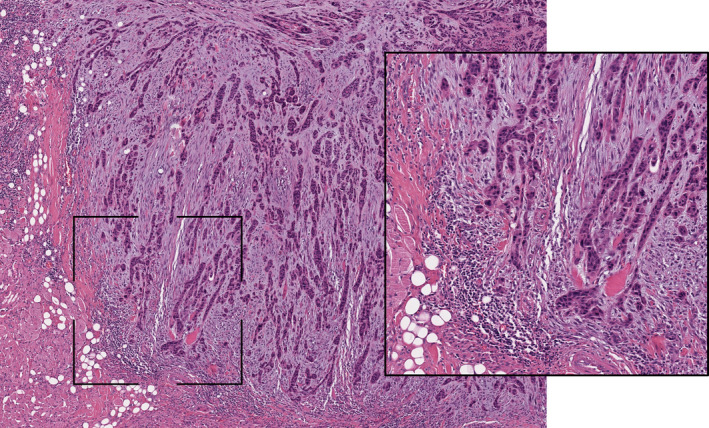
Representative pictures of immune‐excluded phenotype in oral tongue squamous cells carcinoma (hematoxylin‐eosin staining, ×20 magnification). The inset area of greater magnification showed the presence of a T cell infiltrate only in the stromal area around the tumor border