
FIGURE 4.
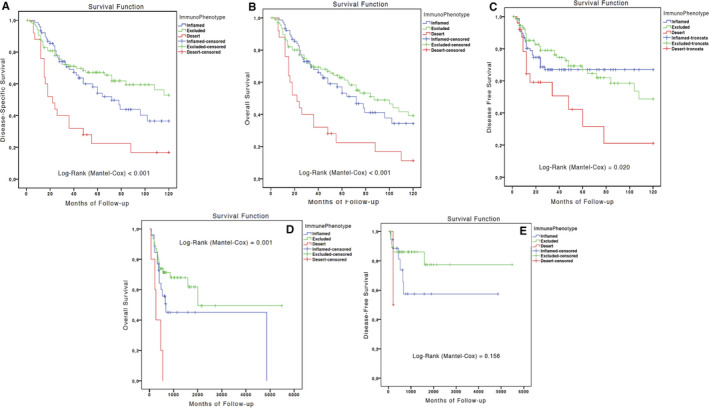
A‐E, Kaplan‐Meier curves for disease‐specific survival (A), overall survival (OS) (B), and disease‐free survival (DFS) (C) in the Italian cohort; and OS (D) and DFS (E) in the The Cancer Genome Atlas cohort
Official websites use .gov
A
.gov website belongs to an official
government organization in the United States.
Secure .gov websites use HTTPS
A lock (
) or https:// means you've safely
connected to the .gov website. Share sensitive
information only on official, secure websites.
A‐E, Kaplan‐Meier curves for disease‐specific survival (A), overall survival (OS) (B), and disease‐free survival (DFS) (C) in the Italian cohort; and OS (D) and DFS (E) in the The Cancer Genome Atlas cohort