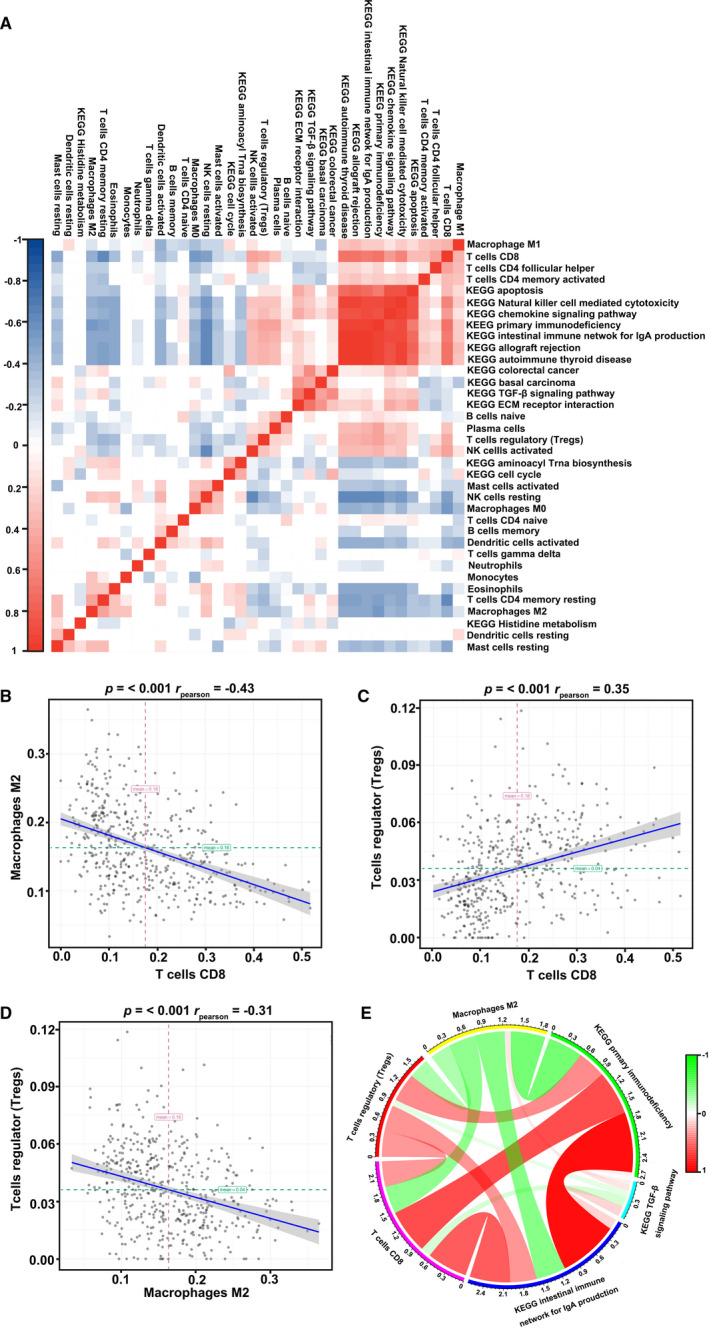
Figure 5.

Co‐expression of immune cells in melanoma tissues. (A) Correlation heatmaps of immune cells and altered pathways in melanoma tissues. Relationship between CD8+ T cells and M2 macrophages (B), CD8+ T cells and Treg (C), and M2 macrophages with Treg (D) in melanoma tissues after analysis. (E) Circos plot of the relationship between altered immune cells CD8+ T cells, M2 macrophages, Tregs, and the intestinal immune network for IgA, primary immunodeficiency, and TGF‐β signaling pathway
