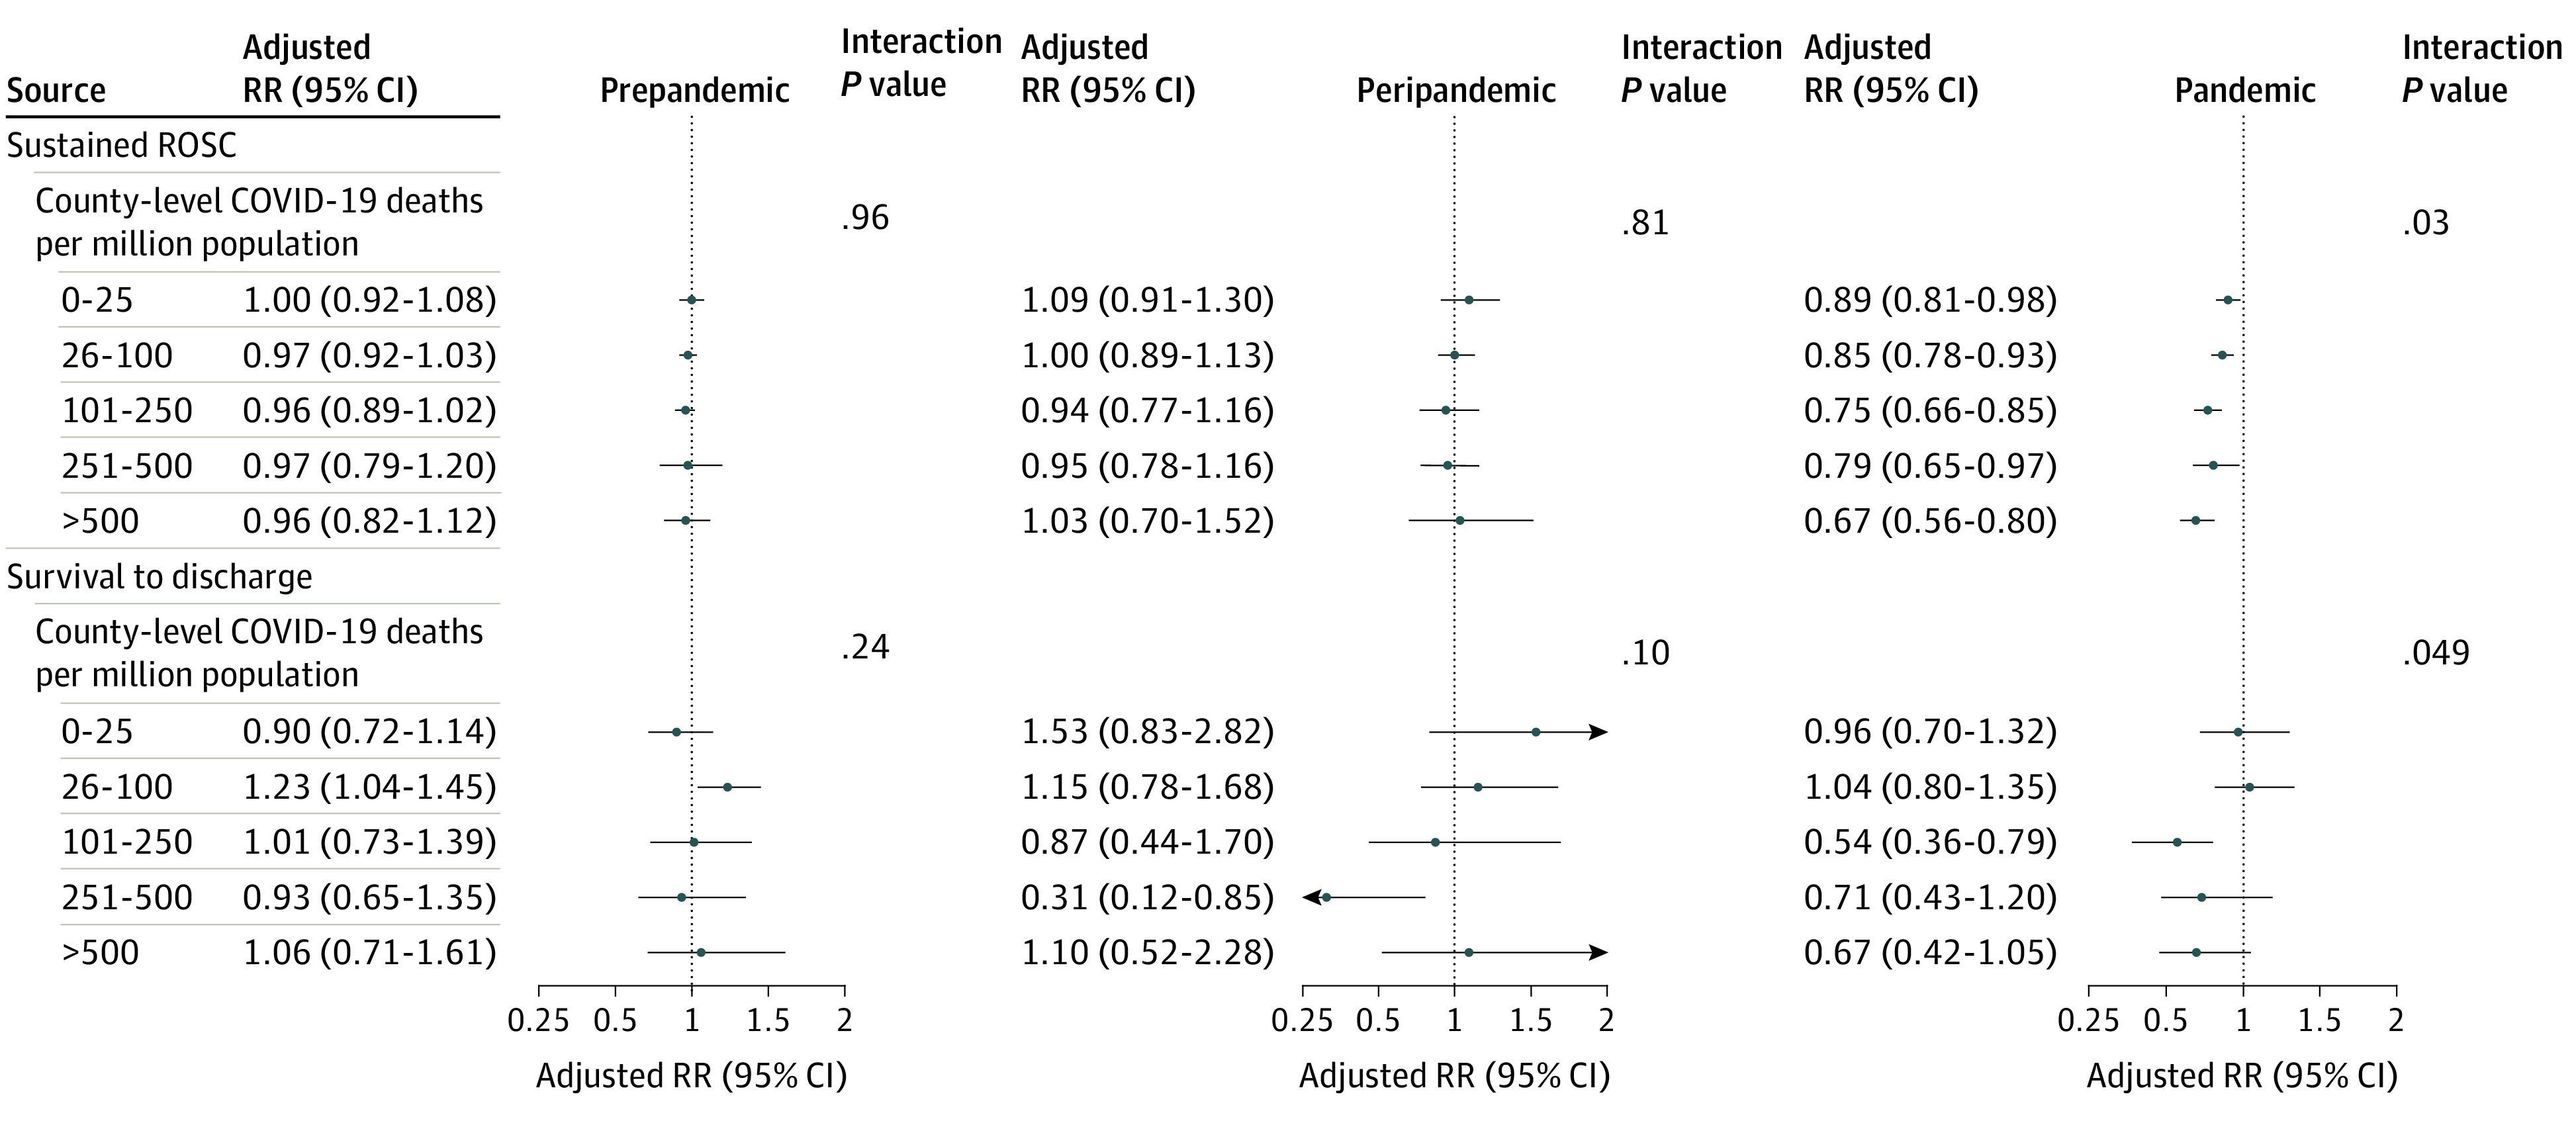
Figure 3. Comparison of 2020 vs 2019 Rates of Sustained Return of Spontaneous Circulation (ROSC) and Survival to Discharge During the Prepandemic, Peripandemic, and Pandemic Periods.

The analysis for the outcome of survival to discharge was restricted to emergency medical services agencies with complete data on this outcome. The prepandemic period was January through February; the peripandemic period, March 1 through 15; and the pandemic period, March 16 through April. COVID-19 indicates coronavirus disease 2019; RR, rate ratio.
