
Figure 6. Model output and experimental data.
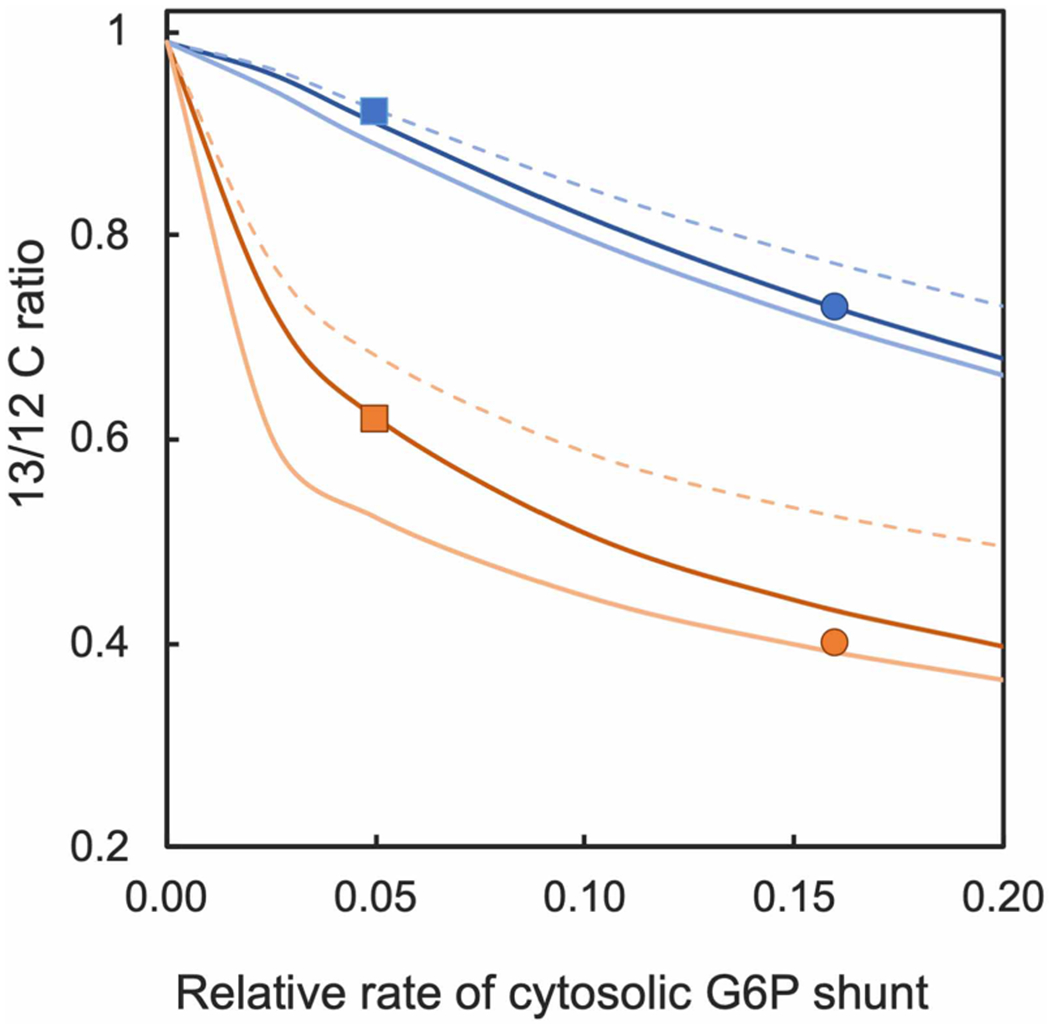
Lines show how ADP glucose (ADPG) (in blue) and UDP glucose (UDPG) (in orange) vary as a function of the rate of the G6P shunt in the cytosol (relative to net CO2 assimilation). Data from Figure 4 were placed at a rate determined by the value for ADPG. Squares are data for 30°C and circles are data for 40°C. The dashed lines assume that 30% of carbon fixation is devoted to sucrose synthesis (v3 in the model = 0.7) and the carbon entering the G6P shunt is 22% labeled (label in sucrose after 20 min of labeling reported by Szecowka et al. [5]). The solid dark lines assume that 30% of carbon fixation is devoted to sucrose synthesis and the carbon entering the G6P shunt is 6.6% labeled (natural abundance 13C time six carbons). The solid light lines assume that 10% of carbon fixation is devoted to sucrose synthesis (v3 in the model = 0.9) and the carbon entering the G6P shunt is 6.6% labeled (natural abundance 13C).