Abstract
In this paper, we are presenting an epidemiological model for exploring the transmission of outbreaks caused by viral infections. Mathematics and statistics are still at the cutting edge of technology where scientific experts, health facilities, and government deal with infection and disease transmission issues. The model has implicitly applied to COVID-19, a transmittable disease by the SARS-CoV-2 virus. The SIR model (Susceptible-Infection-Recovered) used as a context for examining the nature of the pandemic. Though, some of the mathematical model assumptions have been improved evaluation of the contamination-free from excessive predictions. The objective of this study is to provide a simple but effective explanatory model for the prediction of the future development of infection and for checking the effectiveness of containment and lock-down. We proposed a SIR model with a flattening curve and herd immunity based on a susceptible population that grows over time and difference in mortality and birth rates. It illustrates how a disease behaves over time, taking variables such as the number of sensitive individuals in the community and the number of those who are immune. It accurately model the disease and their lessons on the importance of immunization and herd immunity. The outcomes obtained from the simulation of the COVID-19 outbreak in India make it possible to formulate projections and forecasts for the future epidemic progress circumstance in India.
Keywords: SIR model, Flatten-curve, Herd immunity, COVID-19, Outbreaks
Introduction
COVID-19 is a new pathogenic infection disease evolving rapidly. As per the report on April 26, 2020, more than 2.92 million cases have been recorded in 210 countries and territories, 203,000 deaths, and around 829,000 people have recovered globally. Millions of people are forced to remain self-isolated and under challenging conditions by national governments. The disease is proliferating in many countries all around the world. In the absence of proper vaccines, self-quarantine and wearing a face mask is the widely used strategy for the mitigation and control of the outbreak (Kumar et al. 2020). Currently, no adequate medicinal practices or antibiotics are available for the treatment or mitigation of COVID-19. Non-pharmacological measures like quarantine, social distancing, and containment are the only way to react to the epidemic. Isolation relates to the classification of symptomatic people, and quarantine is the constraint for asymptomatic, stable people with a verified or assumed contact. Quarantine may be imposed freely or legitimately by officials and may introduce at the level of an individual, group, or population (group quarantine) (Cetron and Landwirth 2005). A latest sustained analysis has shown that containment can negatively impact post-traumatic stress symptoms, uncertainty, and frustration (Brooks et al. 2020). At present, the world health organization and the center for disease controlling and prevention (CDC), relying on the SARS-CoV-2 incubation period projected and advise to take 14 days of isolation for individuals in close contact with a suspected case (Singhal 2020). The total death rate expected to range from 2 to 3%, and the diseases can be severe for the aged around 27% for 60+ age groups as well as those underlying with health background (Singhal 2020). (Wu and McGoogan 2020) addressed features of COVID-19 disease that identify symptoms and the processes involved.
India’s first recognized a case of COVID-19 in a student who came back from Wuhan, China, on January 30, 2020. India restricted international travel bans lockdown from March 21, 2020. Moreover, countries like India are at high risk due to a sizeable sparse population, minimal infrastructure, and healthcare systems to accommodate too high standards. In contrast, factors like hot climate and moisture (Araujo and Naimi 2020). A large number of the youth and probable immunity from Bacillus Calmette Guerin (BCG) might protect India (Salman and Salem 2020). (Nikakhtar and Hsiang 2014) demonstrated an uncertain situation like an outbreak might affect the patient flow in the healthcare system, so the performance of the system is affected. The primary motivation of the system to identify cost-effective, robust alternative designs for the medical system by comparing with conventional healthcare simulation models, in which patients are assumed to arrive at the system to determine or based on probability distribution.
Mathematical models are required in this context to estimate transmission of the disease, recovery, death, and other related values based on different countries, which are the high to low recorded specific areas of COVID-19. Many countries have already undertaken precise and distinct steps to manage the spread of the disease. Besides that, it is still challenging to recognize significant aspects like population density, inadequate evidence of various symptoms, transmission mechanism, and unavailability of a proper vaccine makes it challenging to handle with such a highly contagious and fatal disease in specific countries with high population density like India (Priya et al. 2020; Pulla 2020). Susceptible, Infectious, or Susceptible again (SIS), Susceptible, Infectious or Recovered (SIR), and Susceptible, Infectious, or Recovered and Susceptible again (SIRS) are some widely recognized models used in practical scenarios (Rocha 2012). The first one is utilized predominantly in the analysis of disease where recovery will not prevent the recontamination of the person, probably caused by pathogenic species (Britton 2012). The second one for model outbreaks, including contagious diseases like COVID-19, was initiated by Severe Acute Respiratory Syndrome Coronavirus 2 (SARS-CoV-2) (Brauer 2017). The third is generally used to analyze influenza-related conditions, as it provides the simulation of contexts where recovered persons lose their immune (Anderson and May 1979).
In recent times, most experimental studies used the modeling approach with real occurrence datasets from the state involved. Different characteristics have been examined by different parameters of the epidemic and the results of prevention efforts in various countries. It is vital to strengthen mathematical models to focus on providing perspectives and forecasts on the disease outbreak and develop efficient control strategies and policies. Modeling techniques are useful for understanding and forecasting the potential and nature of the disease outbreak and providing valuable information to assess the strength of COVID-19. The present study addresses the creation of a variant of the SIR model with herd immunity and flatten off the curve to protect the specific conditions presented in the India context like (1) Daily mortality and birth rate (it change over time of population). (2) Progressive reduction of the population susceptible to the disease by social distancing initiatives. Here a change is considered in the assumption that the whole population evaluated is susceptible to transmission of the disease. The SIR model is adopted in this paper for the consequences of multiple disease preventive interventions of various time by forecasting Covid-19’s epidemiological pattern in India through an updated and configured model. The India situation until April, 26 had more than 26,917 confirmed cases of infection, with 826 cases death from the diseases. The rapid increase in situations of outbreak indicates a need to undertake surveys related to the activity of the epidemic to control the current situation and to ensure advancements in the creation of tools that will allow the long term study of the conduct of pandemics in the future from the first cases. More dynamic and compartmental models have to discuss in the future research gap. Nosocomial risk of disease, i.e., COVID-19 infection transmitting from the hospital, has to be researched and analyzed in the future. The other significant influence in this study is to provide practical explanations for the effectiveness and understanding of social distancing strategies.
Susceptible, infection, and recovered model for SARS-CoV-2 contamination
Epidemiological model identification
The SIR model used in pathology demonstrates the relationship between the numbers of individuals suspected of disease, those presently with the contamination. As well as individuals who recovered or death in a population at a particular point of time (Kermack and McKendrick 1927; Hethcote 2000).
Statistically, as described below:
where S = number of individuals that are susceptible to COVID-19, I = number of individuals infected with COVID-19, R = number of individuals recovered from COVID-19 through overall immunity, transmission rate, and recovery rate.
Case scenario
By considering N as an overall population of individuals inside the affected environment. It is logical to assume that a fixed number of individuals, whereby there is no birth or death by normal reason and comprise of several susceptible individuals + number of infected individuals + number of recover individuals:
Example N = 135.26 crores (India’s population).
Input: Estimating the spread of Covid-19 in India
Data of S (t), I (t), R (t), and D (t) for t = t0, parameters of and total population P.
Output: Forecast of impending values of S (t), I (t), R (t), and D (t)
Consider that N fixed, with no birth or death, makes sense given 120 days; however, it is a generalization. Such a variable may vary over time, so it determines the variable t = time in day t = 0 at the start of January 30, 2020.
A two-dimensional structure containing three independent quadratic equations with state variables provided as follows:
| 1 |
| 2 |
| 3 |
Equation (1) refer to the rate of change of the number of susceptible to the disease over time.
Equation (2) refer to the rate of change of the number of infected.
Equation (3) refer to the rate of change of the number of people recovered over time.
To estimate (level of spread) and (the level of recovery). We required determining two or more parameters.
D = duration of disease for those recovered from isolation.
M = mortality rate for those who decrease per day (for COVID-19)
d = day; M = mortality’s = susceptible
| 4 |
| 5 |
In Eq. 4, we can identify the rate at which disease transmitted by dividing 1 by the period of the disease. Because certain people may undergo only one recovery in given a reasonable period. For instance, if the span of the infection period is 14 days, then the rate at which those contaminated has recovered is
Equation 5 shows that the infection rate of the disease relies on the death rate and the number of individuals suspected of the disease. It illustrates the rate in which the infection moves from the suspected person to an infected individual. The spread level often lies among the assumption infection rate and death rate.
Assume that individual infected person has number of contacts from the suspected compartment per unit time, and then we represent
| 6 |
If the fraction of the contact made results in a spread of the COVID-19, then each infected person infects person unit time.
= where x = (Spread)
Spread of infection disease (COVID-19) from Eq. 1
= − SI (1) the only way a person can leave the suspected compartment by coming into contact with having COVID-19, and thereby the equation’s right side is negative (1).
Moreover, we have
From Eq. 3
= , the only way an individual has recovered or death has infected with COVID-19.
Since 0 S(t) S(0) N and R(0) R(t) N.
As overall population given by N = S + I + R.
The primary aim of this paper is to estimate the parameters of the Susceptible, Infected, and Recovered model from available data. So it precisely forecasts the behavior of the COVID-19 spread in India.
Proposed SIR model prediction for SARS-CoV-2
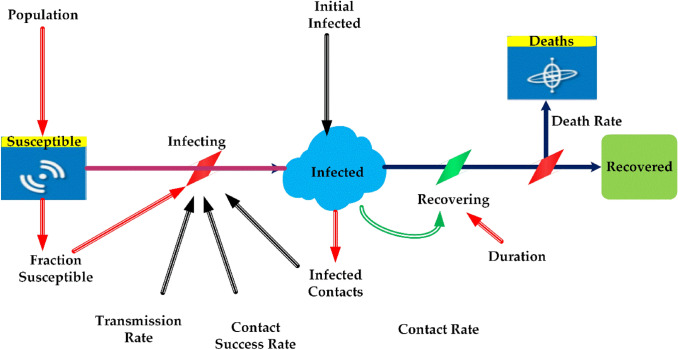
The initial population of susceptible individuals S(t0) that helps to identify the future values of discovered infected I(t) discovered recovered R(t) and death individuals D(t), as shown in Fig. 1. The variable information related to the SIR model for COVID-19 is discussed in Table 1. The parameters used for COVID-19, such as variable name, type, units, equation, and initial value using the tool vensim and its interaction, are explained with the SIR model.
Fig. 1.
SIR model prediction for Covid-19
Table 1.
Variable information of SIR model for Covid-19
| Name | Type | Units | Equation | Initial value |
|---|---|---|---|---|
| Population | Constant | People | 1e+06 | – |
| Susceptible | Level | People | Infecting | Population—initial infected |
| Infection | Level | People | Infecting-recovery | Initial infected |
| Recovered | Level | People | Recovering | 0 |
| Fraction susceptible | Auxiliary | Fraction | Susceptible/population | – |
| Infecting | Auxiliary | People/day | Infected contacts*fraction susceptible*contact success rate | – |
| Recovering | Auxiliary | People/day | Infected/duration | – |
| Contact success rate | Constant | Fraction | 0.1 | – |
| Infected constant | Auxiliary | People/day | Contact rate*Infection | – |
| Contact rate | Constant | People/person/day | 10 | – |
| Duration | Constant | Days | 14 | – |
| Initial infection | Constant | Person | 1 | – |
| Transmission rate | Auxiliary | Fraction/day | Reproduction ratio/duration*fraction susceptible | |
| Growth rate | Constant | Fraction/day | 0.28 | – |
| Deaths | Level | People | Dying | 0 |
| Dying | Auxiliary | People/day | Infected*fatality rate*infected duration | – |
Experimental results
The method of representing the SIR model graphically is shown below:
Figure 2 explains the susceptible cases of SARS-CoV-2 around more than one lakh people are susceptible during the initial time of outburst, and future values are predicted in upcoming days. The Infected individuals crossed nearly 17,000 in the April month is predicted is shown in Fig. 3. The people who recovered from the infection are shown in Fig. 4. The recovery rate is continuously the opposite of the transmittable period. Figures 5 and 6, the prediction of possible death and dying rate is estimated. The dying rate is predicted by the number of infected individuals multiple with the fatality rate and infected duration. Figure 7 shows the fatality rate where the transmission rate, as shown in Fig. 8, it is predicted by the reproduction ratio/duration multiplied with the fraction susceptible. The susceptible fraction value is determined by susceptible by population. Figure 9 explains the spread of SARS-CoV-2 in India from the start date until April month in India. The confirmed, infected, and death values are represented in a graph.
Fig. 2.
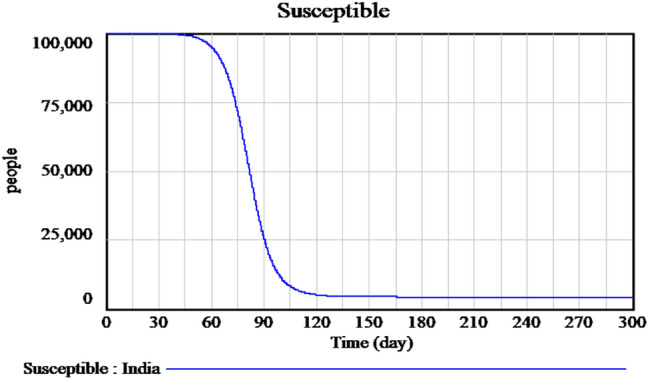
Forecasting of time-dependent SIR model of susceptible individuals of SARS-CoV-2 in India
Fig. 3.
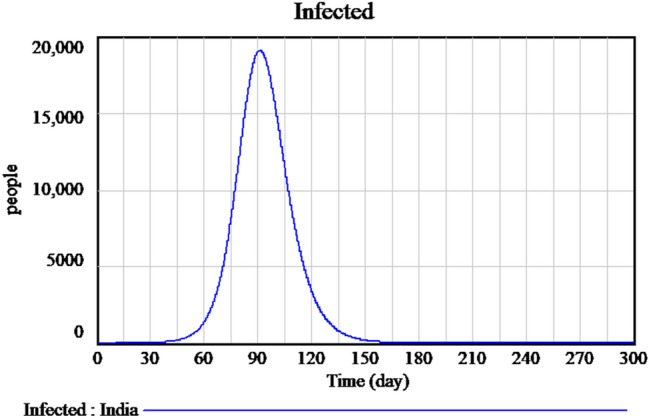
Forecasting of time-dependent SIR model of infected cases of SARS-CoV-2 in India
Fig. 4.
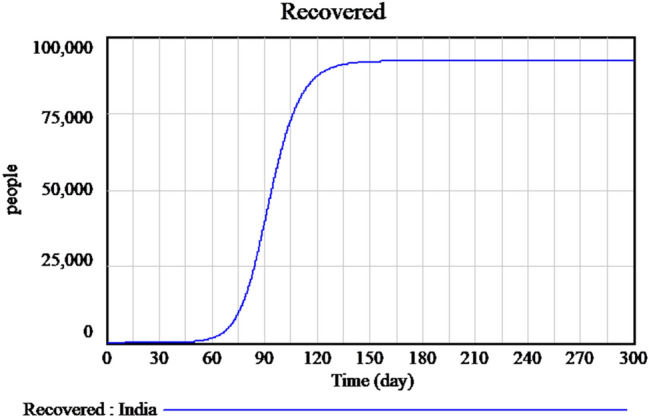
Forecasting of time-dependent SIR model of recovered cases of SARS-CoV-2 in India
Fig. 5.
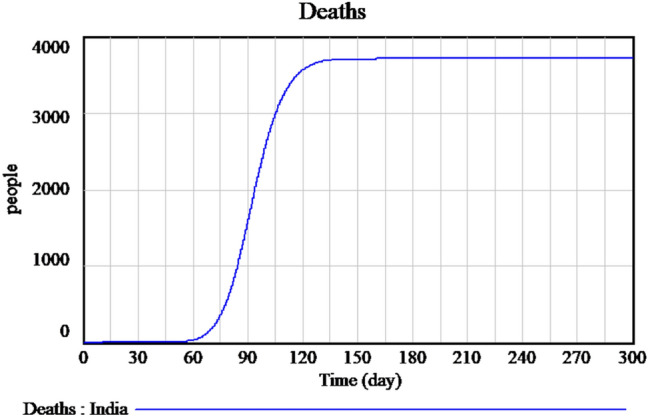
Forecasting of time-dependent SIR model of death cases of SARS-CoV-2 in India
Fig. 6.
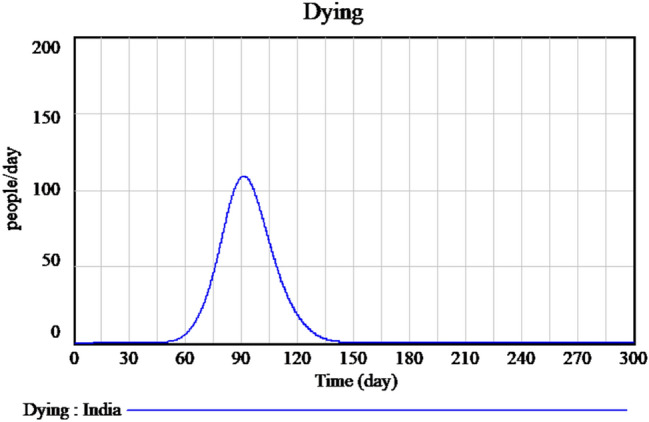
Forecasting of time-dependent SIR model of dying cases of SARS-CoV-2 in India
Fig. 7.
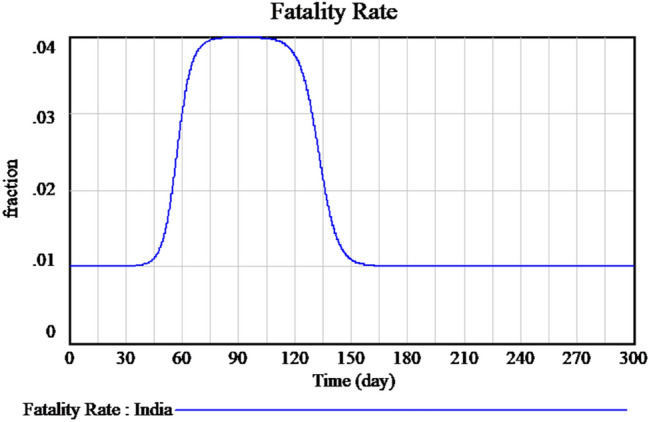
Measured of fatality rate of SARS-CoV-2 in India
Fig. 8.
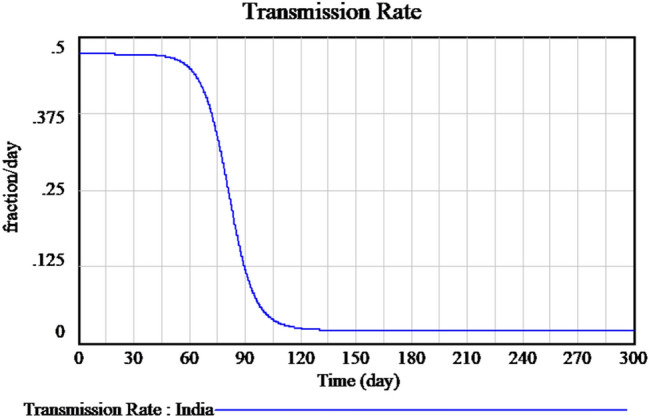
Measured of transmission rate of SARS-CoV-2 in India
Fig. 9.
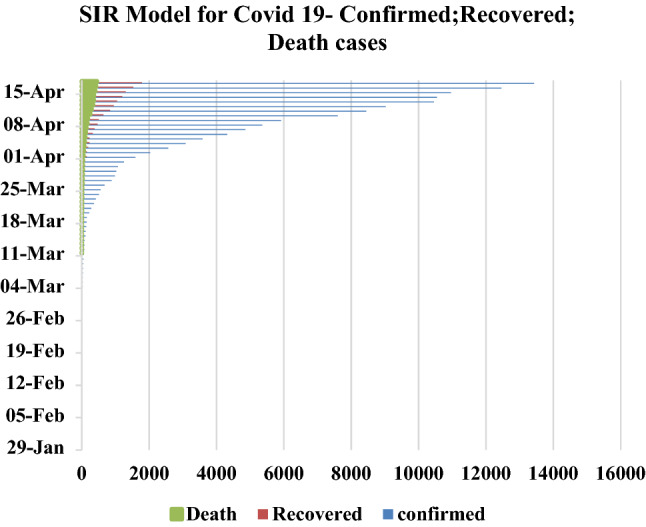
SIR Model for Covid-19 pandemic course for January to April period 2020
Flatten of curve
Flattening of the curve is a public health method initiated during the COVID-19 disease outbreak. The curve to be flattened is the outbreak curve; it could be a graphical image of the number of individuals contaminated who need medical care over the period. A medical system may break down during an outbreak when the proportion of people contamination surpasses the health care system’s strength to take care of them. Flattening the curve refers to reducing the transmission of the infection to the maximum number of individuals seeking the treatment at a time is minimized and not strains the medical system. Flattening the curve is based on preventative measures like social distancing.
Concerns were raised to flatten the curve results in the following: (i) reduction in the maximum amount of cases to avoid crippling the health system and (ii) a rise in the duration of the pandemic with the total number of pending cases remains the same. The lockdown will radically change the fundamental method of contamination. Figure 10 shows the most recent data of a sample decrease in the number of infected individuals because of lockdown measures imposed by the government. It is that by flattening the curve, the peak number of spread will decrease; moreover, the total number of spread will be the same, and the duration of an outbreak will be longer since concluded that by flattening the curve, it will have a lesser impact upon the demands in hospitals. Figure 11 explains the flatten curve of active infected and future predictions if the lockdown measures are not followed.
Fig. 10.
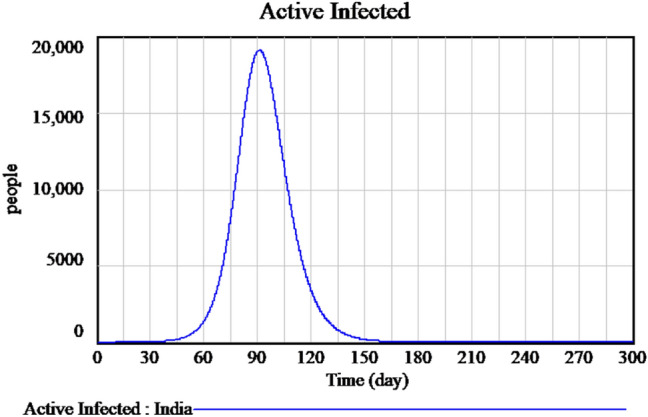
Flatten curve of active infected during the lockdown period
Fig. 11.
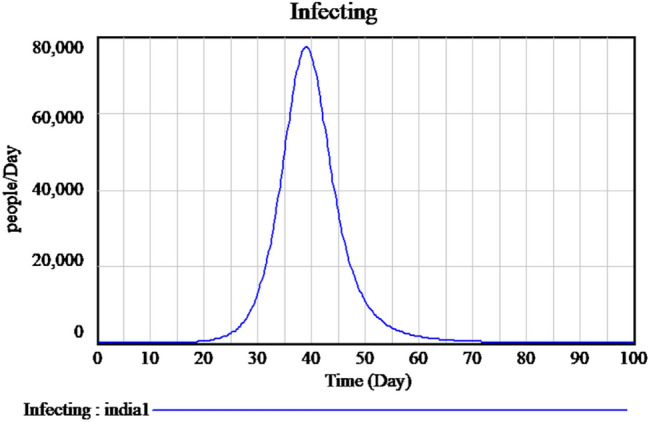
Flatten curve of active infected during unlock down period
Herd immunity
The herd immunity method might require the transmission of contagious virus (SARS-CoV-2) to raise the immunity of the herd population, thereby shielding both the aged as well as those with multiple chronic health conditions who are most susceptible towards this virus (Fine et al. 2011). The R0 outbreak estimates calculation, like how many individuals per infected individual transfers the virus around. Initial calculations for the threshold of the herd immunity presumed that every member of the community had an equivalent susceptibility to the virus. We required to estimate the primary reproductive number ) or active reproductive number ) for a given population. The estimated number of secondary infections calculates the reproductive rate R0 in Herd Immunity in a fully responsive population caused by a single contagious person. represent the number of secondary cases developed by one infected person in a susceptible or well-mixed population (Anderson et al. 1992). ) used real-life information from prognostic or therapeutic surveillance to calculate reproductive statistics for the current outbreak.
By using ), we can estimate the minimum stage of an individual’s immunity.
= vaccination or naturally–induced (after recovered from COVID-19). To stop the transmission of the virus to the population, we used formula as = 1− (Rocha 2012; Singhal 2020).
For example, if the value = 4 then = 0.75 (minimum of 2/3 population required to be immune).
Further, there is a difference in and . It represents the percentage of previously immune people (maybe either vaccination or natural infection).
Alternate way of estimating for infection in a given population is by multiplying with by the amount of the population that is non-immune (susceptible to the infection). Hence = (if all are susceptible). It means any partial or pre-existing immunity to the pathogen agent can decrease the number of excepted secondary case growth (Kwok et al. 2020).
With COVID-19 being such an extremely transmissible disease, it shows the value of vaccination rates in our societies. It is necessary to point out that there have been more than 100 cr cases of SARS-CoV-2 worldwide before the vaccine was created.
A certain degree of immunity within our populations must be preserved to prevent potential outbreaks. This amount can be determined using the specified herd immunity threshold. To calculate the threshold, the basic reproduction number R0, which for SARS-CoV-2, is between 3 and 4 values, as shown in Fig. 12.
Fig. 12.
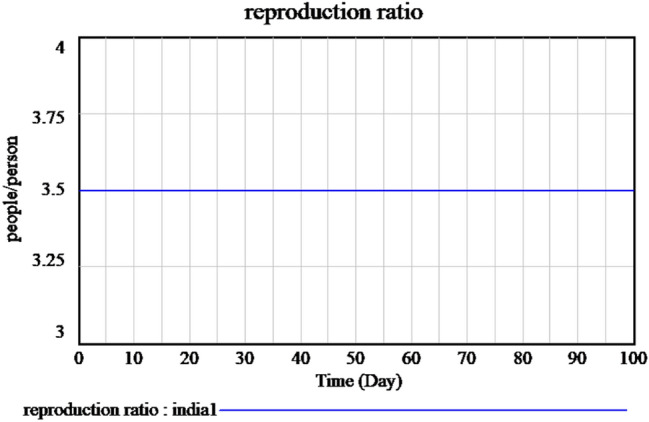
Basic reproduction rate of time-dependent SIR model of the SARS-Cov-2 in India
Conclusion
In this article, we proposed a SIR model with a flattening curve and herd immunity based on a susceptible population that grows over time and difference in mortality and birth rates. The research was carried out as a matter of priority for the emerging COVID-19 infection to provide a simple but effective explicative model for predicting the future evolution of the contamination and verify the confining and locking measures were successful. It is advisable to encourage the implementation of lockdown policies to avoid massive contamination of the population by May 2020. Strict adequate measures must be enforced to continue to prevent and manage the spread of COVID-19. Countries worldwide have produced significant steps to reduce the number of infected citizens, like lock-down measures, awareness program generated through media, sanitization campaigns to slow down the spread of the disease. Additional measures like early detection approaches, isolation of susceptible individuals to prevent mixing them with no-symptoms and self-quarantine individuals, traffic restrictions, and medical treatment helps to prevent the increase in the number of infected individuals. Strong lockdown policies have to implement in all over the country if it is possible. Our simulation results show the number of susceptible, infected, and recovered persons, and also, the transmission rate and fatality rate concerning time tracks the outburst of SARS-CoV-2 in India. The effects of lockdown and herd immunity reduce the spread of transmission. By adopting herd immunity and flatten curve the effective measures, the number of susceptible individuals can be decreased and combined with isolating infected people, will decrease the peak number of spread. When this is achieved, it shortens the time the virus influence society.
Future in this scenario, the transmission of scientific information and awareness-raising programs are of extreme importance in providing some spotlight on the role of isolation strategies in outbreak circumstances. The model also provides susceptibility reduction in the context of social initiatives to manage the progression of the disease. Moreover, as the model data represent, one certain thing is that COVID-19 is not going to go way faster or easier. The limitations of the SIR model used here is only a simple one, and predictions that come out might not be accurate enough; sometimes, it also depends on the published data and their constancy. We reviewed the case of the outbreak in India, worth investigating that given demographics of the country could have a significant result on the worldwide economy, not even overlook the drastic consequences on the social and economic system of the country. Necessity public health policies have to implement in countries with a high spread of COVID-19 cases as early as possible to manage its spread. Different mathematical models can be worked out for the epidemiology model to improve the prediction results further.
Funding
Not Applicable.
Data availability
No data or code were generated or used during the study.
Compliance with ethical standards
Conflict of interest
All authors declare that we have no conflict of interest.
Footnotes
Publisher's Note
Springer Nature remains neutral with regard to jurisdictional claims in published maps and institutional affiliations.
Contributor Information
Maheshwari Venkatasen, Email: maheshwarivenkat24@gmail.com.
Sandeep Kumar Mathivanan, Email: sandeepkumarm322@gmail.com.
Prabhu Jayagopal, Email: jprabhuit@gmail.com.
Prasanna Mani, Email: prasanna.m@vit.ac.in.
Sukumar Rajendran, Email: sukuraj2019@gmail.com.
UmaShankar Subramaniam, Email: usubramaniam@psu.edu.sa.
Aroul Canessane Ramalingam, Email: aroulcanessane@gmail.com.
Vijay Anand Rajasekaran, Email: vijayanand.r@vit.ac.in.
Alagiri Indirajithu, Email: ialagiri@vit.ac.in.
Manivannan Sorakaya Somanathan, Email: manivannan.ss@vit.ac.in.
References
- Anderson RM, May RM. Population biology of infectious diseases: part I. Nature. 1979;280(5721):361–367. doi: 10.1038/280361a0. [DOI] [PubMed] [Google Scholar]
- Anderson RM, Anderson B, May RM. Infectious diseases of humans: dynamics and control. Oxf Univ Press. 1992;108(1):211. doi: 10.1001/jama.1992.03490230111047. [DOI] [Google Scholar]
- Araujo MB, Naimi B. Spread of SARS-CoV-2 Coronavirus likely to be constrained by climate. medRxiv. 2020 doi: 10.1101/2020.03.12.20034728. [DOI] [Google Scholar]
- Brauer F. Mathematical epidemiology: past, present, and future. Infect Dis Model. 2017;2(2):113–127. doi: 10.1016/j.idm.2017.02.001. [DOI] [PMC free article] [PubMed] [Google Scholar]
- Britton NF. Essential mathematical biology. London: Springer; 2012. [Google Scholar]
- Brooks SK, Webster RK, Smith LE, et al. The psychological impact of quarantine and how to reduce it: rapid review of the evidence. The Lancet. 2020;395(10227):912–920. doi: 10.1016/S0140-6736(20)30460-8. [DOI] [PMC free article] [PubMed] [Google Scholar]
- Cetron M, Landwirth J. Public health and ethical considerations in planning for quarantine. Yale J Biol Med. 2005;78(5):329–334. [PMC free article] [PubMed] [Google Scholar]
- Fine P, Eames K, Heymann DL. “Herd immunity”: a rough guide. Clin Infect Dis. 2011;52(7):911–916. doi: 10.1093/cid/cir007. [DOI] [PubMed] [Google Scholar]
- Hethcote HW. The mathematics of infectious diseases. SIAM Rev. 2000;42(4):599–653. doi: 10.1137/S0036144500371907. [DOI] [Google Scholar]
- Kermack WO, McKendrick AG. A contribution to the mathematical theory of epidemics. Proc R Soc Lond A. 1927;115(772):700–721. doi: 10.1098/rspa.1927.0118. [DOI] [Google Scholar]
- Kumar S, Maheshwari V, Prabhu J, Prasanna M, et al. Social economic impact of COVID-19 outbreak in India. Int J Pervasive Comput Commun. 2020;16(4):309–319. doi: 10.1108/IJPCC-06-2020-0053. [DOI] [Google Scholar]
- Kwok OK, Lai F, et al. Herd immunity–estimating the level required to halt the COVID-19 epidemics in affected countries. J Infect. 2020;80(6):32–33. doi: 10.1016/j.jinf.2020.03.027. [DOI] [PMC free article] [PubMed] [Google Scholar]
- Nikakhtar A, Hsiang SM. Incorporating the dynamics of epidemics in simulation models of healthcare systems. Simul Model Pract Theory. 2014;43:67–78. doi: 10.1016/j.simpat.2014.01.007. [DOI] [Google Scholar]
- Priya KB, Rajendran P, Kumar SM et al. Pediatric and geriatric immunity network mobile computational model for COVID-19. Int J Pervasive Comput Commun. 2020;16(4):321–330. doi: 10.1108/IJPCC-06-2020-0054. [DOI] [Google Scholar]
- Pulla P. Covid-19: India imposes lockdown for 21 days and cases rise. BMJ. 2020;26:368. doi: 10.1136/bmj.m1251. [DOI] [PubMed] [Google Scholar]
- Rocha DIC. Modelos matemáticos aplicados à epidemiologia. Miscelánea Matemática. 2012;44:11–27. doi: 10.21575/25254782rmetg2018vol3n1501. [DOI] [Google Scholar]
- Salman S, Salem ML. The mystery behind childhood sparing by COVID-19. Int J Cancer Biomed Res. 2020;5(1):11–13. doi: 10.21608/jcbr.2020.79888. [DOI] [Google Scholar]
- Singhal T. A review of coronavirus disease-2019 (COVID-19) Indian J Pediatr. 2020;87(4):281–286. doi: 10.1007/s12098-020-03263-6. [DOI] [PMC free article] [PubMed] [Google Scholar]
- Wu Z, McGoogan JM. Characteristics of and important lessons from the coronavirus disease 2019 (COVID-19) outbreak in China: summary of a report of 72 314 cases from the Chinese Center for Disease Control and Prevention. JAMA. 2020;323(13):1239–1242. doi: 10.1001/jama.2020.2648. [DOI] [PubMed] [Google Scholar]
Associated Data
This section collects any data citations, data availability statements, or supplementary materials included in this article.
Data Availability Statement
No data or code were generated or used during the study.


