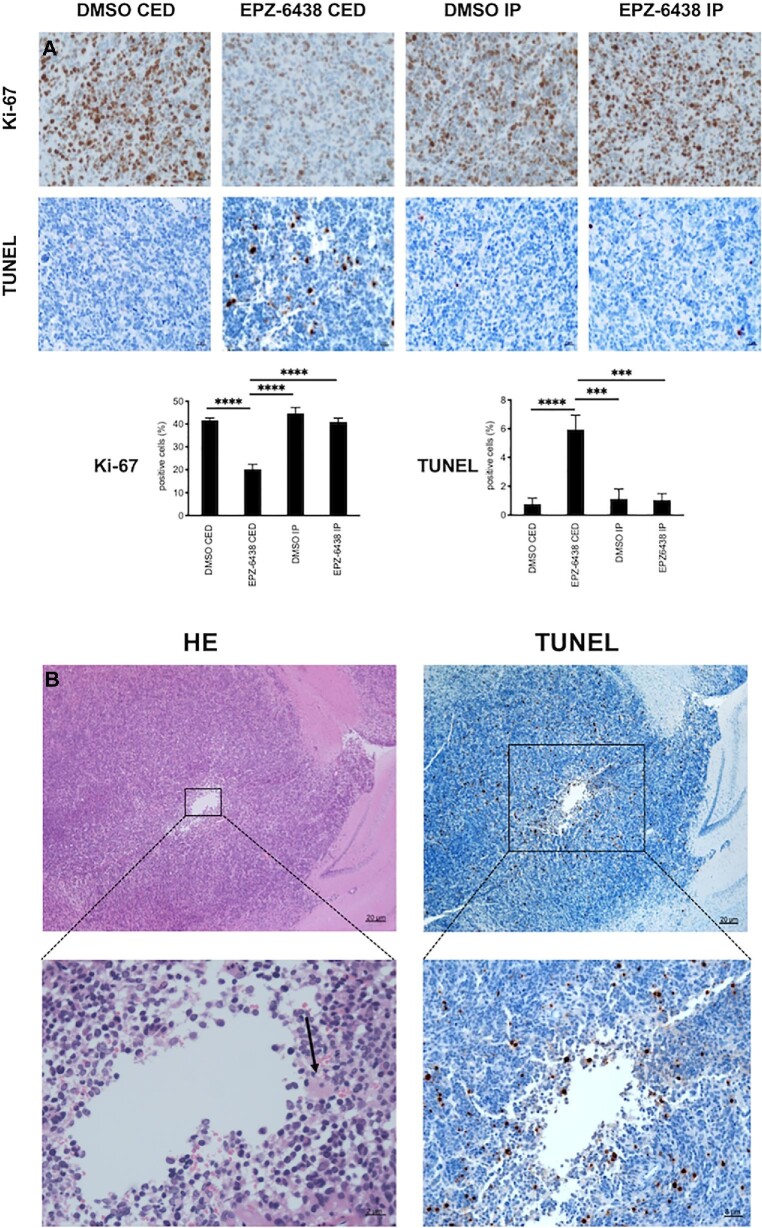
FIGURE 4.
Immunohistochemical analysis of DIPG xenografts treated with EPZ-6438. A, Images of representative Ki-67 and TUNEL staining of intracranial tumor from mice euthanized at the end of treatment. Mean and standard deviation (SD) values represent the average number of positive cells in 3 high-powered fields for each tumor. Statistical analysis was performed ANOVA with Tukey's multiple comparison. Ki-67: CED DMSO vs CED EPZ-6438, ****P < .0001, TUNEL: DMSO CED vs EPZ-6438 CED, ****P < .0001. B, Representative histological changes around the intratumor injection site upon EPZ-6438 administration by CED (left: hematoxylin and eosin (HE) staining, right: TUNEL staining). Black arrow, inflammatory cell infiltration.

