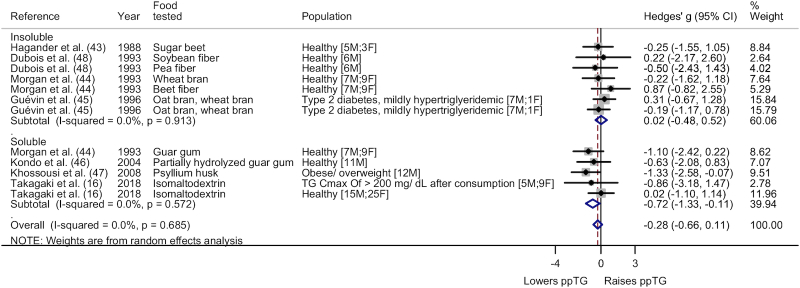
FIGURE 2.
Forest plot of subgroup analysis on type for fiber-rich food or food ingredient category (iAUC). A significant ppTG-lowering effect was noted for soluble fiber (Hedges' g = −0.72; 95% CI: −1.33, −0.11; I2 = 0.0%) whereas no significant difference in ppTG response was noted for insoluble fiber (Hedges' g = 0.02; 95% CI: −0.48, 0.52; I2 = 0.0%). The whiskers on either side of the data points represent the 95% CIs, grey box indicate the % weight of the comparison and the red dashed line indicate the mid-point of the overall effect size diamond. Cmax, peak concentration; F, female; iAUC, incremental area under the curve; M, male; ppTG, postprandial triglyceride; TG, triglyceride.

