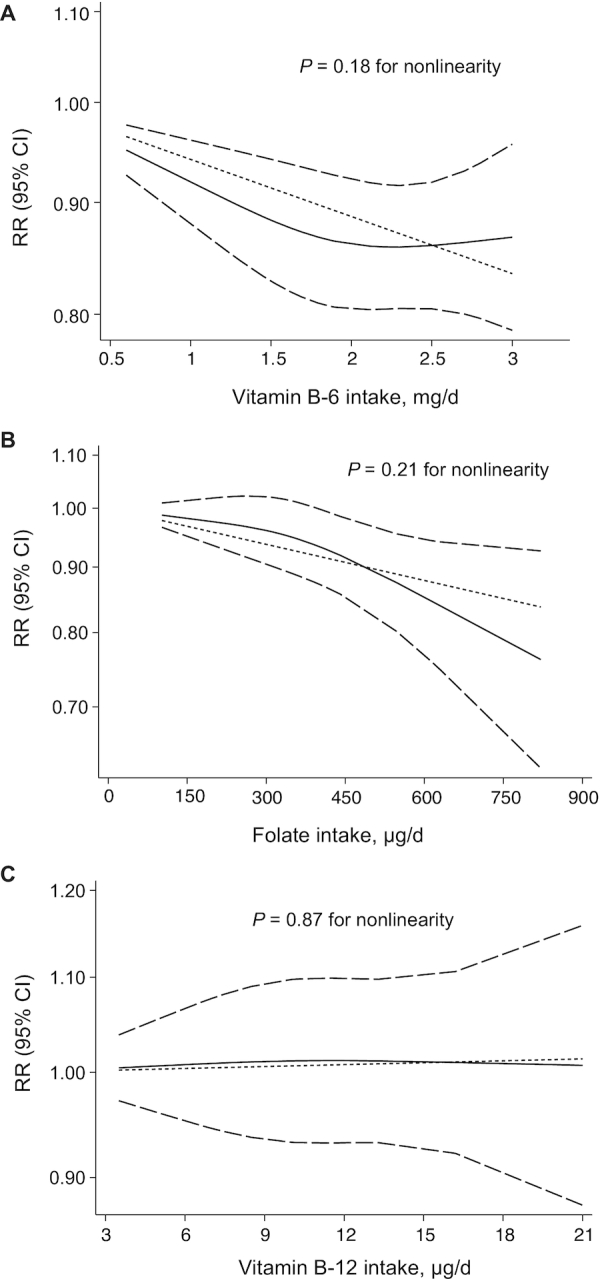
FIGURE 5.

Dose-response analyses of the nonlinear association between the RR of stroke and vitamin B-6 intake (A), folate intake (B), and vitamin B-12 intake (C). Dashed lines indicate the 95% CI. In each panel, the solid line and dashed lines represent the estimated RR and 95% CI, respectively, and the dotted line represents the linear fit to the data.
