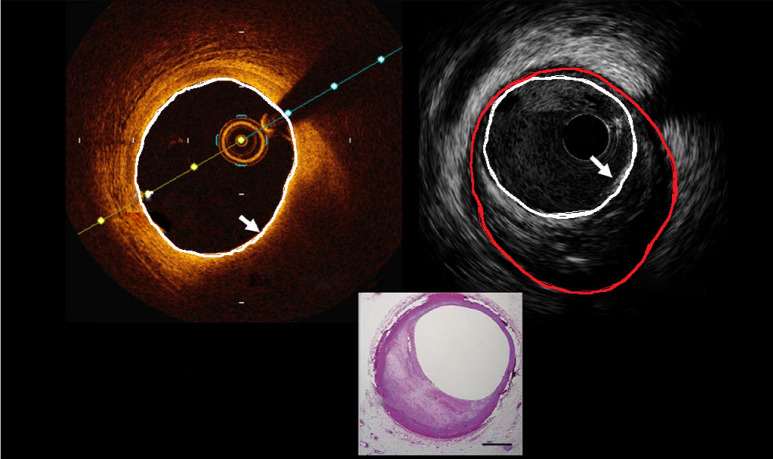
Figure 2.
Thin fibrous plaque with a necrotic core on OCT and IVUS, courtesy Boston Scientific (white circles represent lumen area on the OCT/IVUS images, whereas the red circle represents the true vessel based on the EEM. The white asterisks represent the necrotic core). OCT, optical coherence tomography; IVUS, intravascular ultrasound.

