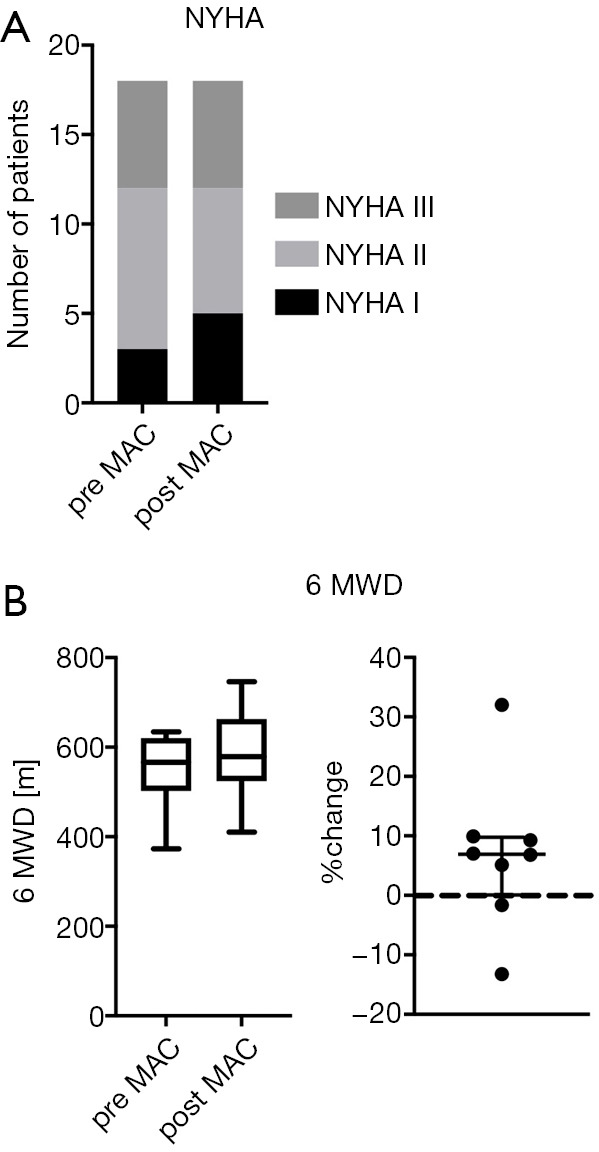
Figure 2.

Clinical assessment. (A) Distribution of the New York Heart Association (NYHA) Functional Classification (FC) of all children (n=18) pre and post macitentan (MAC) start. (B) Six-minute walking distance (6MWD) in meters (m) pre and post macitentan (MAC) start. Left: absolute values. The box and whisker plots (left) show the median, IQR and range. Right: percent change from baseline. The scatter plots (right) show the median with IQR.
