FIG 5.
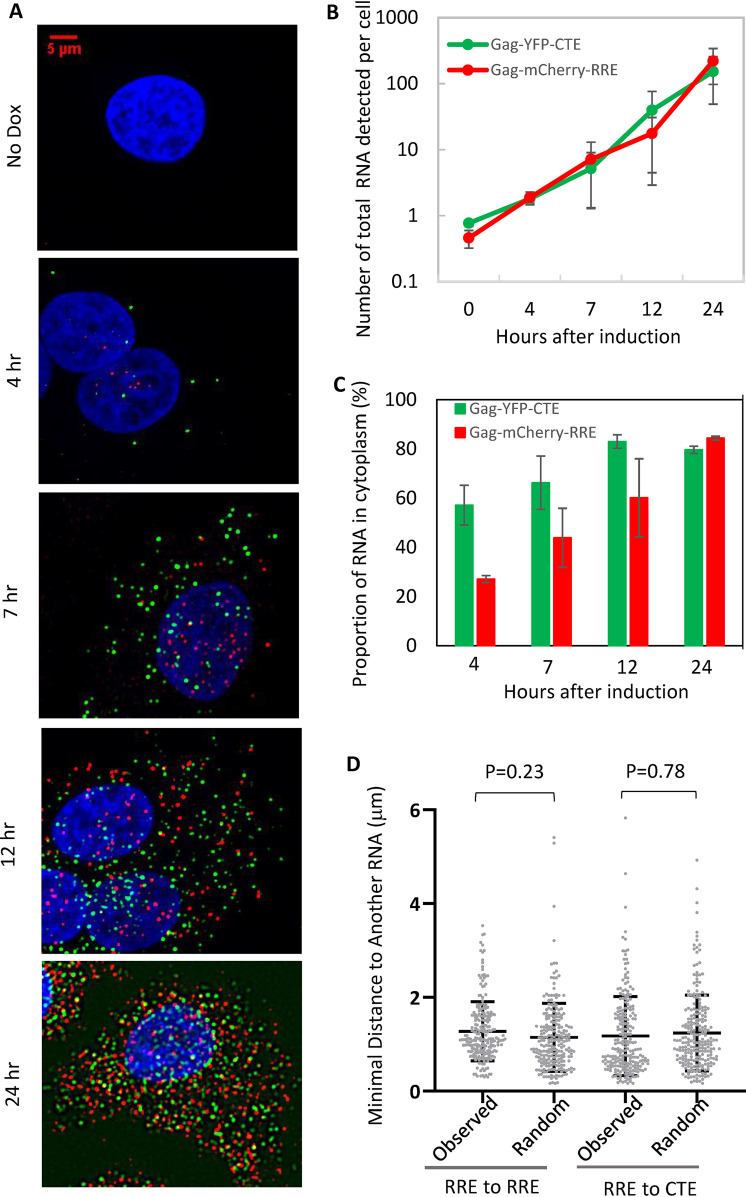
The expression kinetics and subcellular locations of HIV-1 RNA measured using a cell line dually infected with Gag-mCherry-RRE and Gag-YFP-CTE. (A) Representative images of HIV-1 RNA detected by RNAscope. Time points after doxycycline induction are shown to the left of the images. No dox, without doxycycline induction. Signals from mCherry probes, yfp probes, and DAPI stain are shown in red, green, and blue, respectively. (B) Quantitation of RNA accumulation after transcription induction. The number of total RNA signals detected in the equatorial plane of each cell is shown. The results shown are averages of 24, 45, 83, 56, and 34 cells for no dox (0 h) and 4 h, 7 h, 12 h, and 24 h after doxycycline induction, respectively. Error bars, standard deviation. (C) Quantitation of the proportion of RNA signals in the cytoplasm at the indicated hours postinduction. The proportion of cytoplasmic RNA is calculated by dividing the number of cytoplasmic RNAs by the number of total RNAs (RNA in cytoplasm and nucleus). (D) Spatial relationship between Gag-mCherry-RRE and Gag-YFP-CTE RNAs in the cytoplasm. The distances of individual Gag-mCherry-RRE RNA signals to the nearest Gag-mCherry-RRE RNA signal (RRE to RRE) or to the nearest Gag-YFP-CTE RNA signal (RRE to CTE) in the cytoplasm of a representative cell are shown. To generate distances expected from a cell in which Gag-mCherry-RRE and Gag-YFP-CTE RNAs were mixed randomly in the cytoplasm, we used the spatial information of Gag-mCherry-RRE and Gag-YFP-CTE RNAs. Based on the number of Gag-YFP-CTE molecules in the cytoplasm of the cell, we randomly assigned a subset of the total RNAs as Gag-YFP-CTE RNAs and measured the minimal distance of Gag-mCherry-RRE RNAs to Gag-mCherry-RRE RNAs or Gag-YFP-CTE RNAs; these values are shown as “random.”

