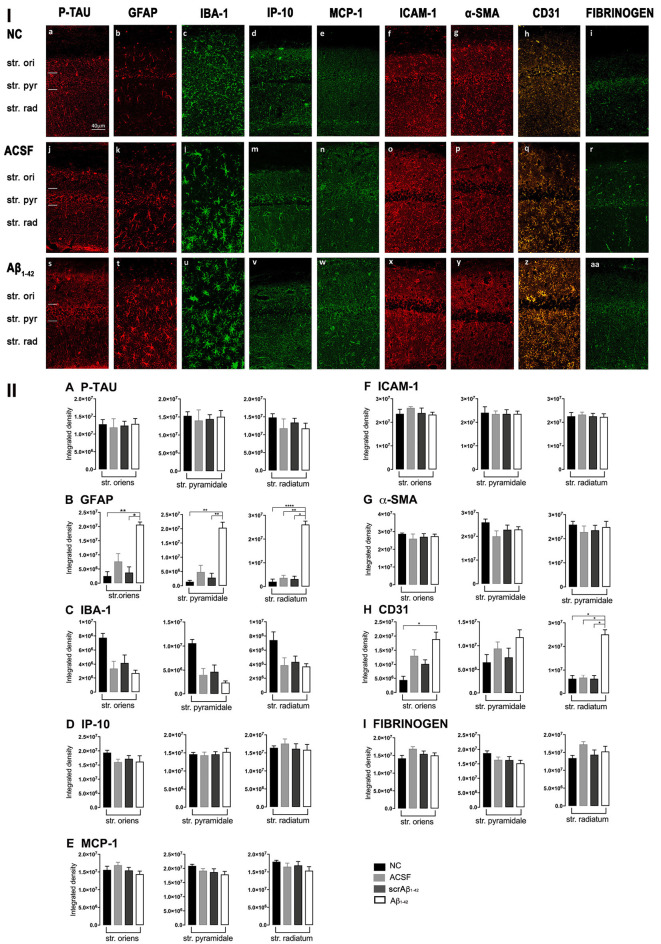
Figure 3.
Panel I: Representative images showing immunolabeling of p-tau, GFAP, Iba-1, IP-10, MCP-1, ICAM-1, α-SMA, CD31, and fibrinogen at a location adjacent to the injection site, 3 days after injection in NC (a–i), ACSF- (j–r) and Aβ1–42-injected (s–aa) mice. Scale bar (40 μm). Panel II: Graphs showing quantification at a location adjacent to the injection site in the CA1 hippocampal region of p-tau, GFAP, Iba-1, IP-10, MCP-1, ICAM-1, α-SMA, CD31, and fibrinogen (A–I) immunolabeling density, 3 days post-injection in NC, ACSF-, scrAβ1–42- and Aβ1–42-injected mice. Data expressed as mean ± SEM (Kruskal–Wallis test; *p < 0.05; **p < 0.01, ****p < 0.0001, n = 6).

