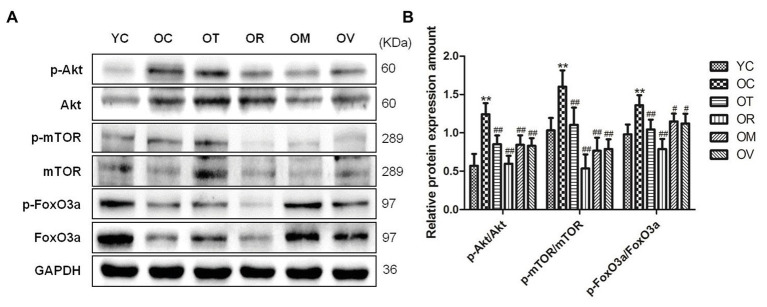
Figure 5.
Western blots of Akt/mTOR and Akt/FoxO3a signal pathways related proteins. (A) The p-AktSer473, Akt, p-mTORSer2448, mTOR, p-FoxO3aSer253, and FoxO3a were subjected to Western blot analysis using corresponding antibodies. (B) Quantitative analysis is corrected for loading with GAPDH. **p < 0.01 vs. YC group; #p < 0.05 and ##p < 0.01 vs. OC group. All data are presented as mean ± standard deviation (M ± SD) from independent experiments performed in triplicate (n = 3) in each group.

