
Figure 1.
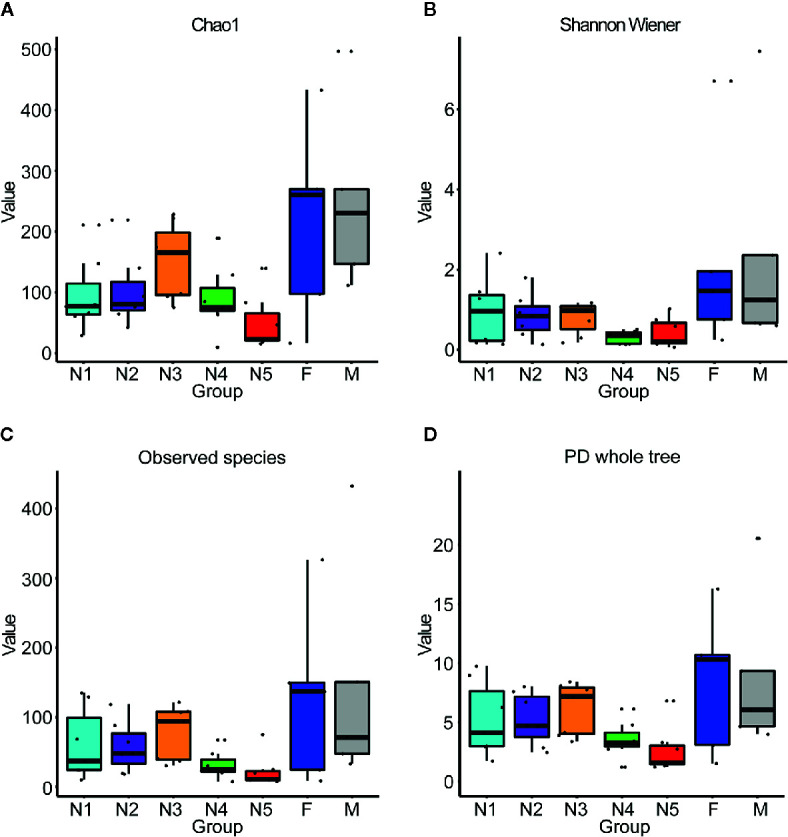
Box plots of 16S rRNA gene sequences obtained from gut samples of T. rubrofasciata across developmental stages based on alpha diversity analyses. Each column represents one group (N1, 1st stage nymphs; N2, 2nd stage nymphs; N3, 3rd stage nymphs; N4, 4th stage nymphs; N5, 5th stage nymphs; F, female adult; M, male adult). The top and bottom whiskers indicate the maximum and minimum values, respectively, and the hyphen represents the median value. (A) Chao1. (B) Shannon Wiener. (C) Observed species. (D) PD whole tree.