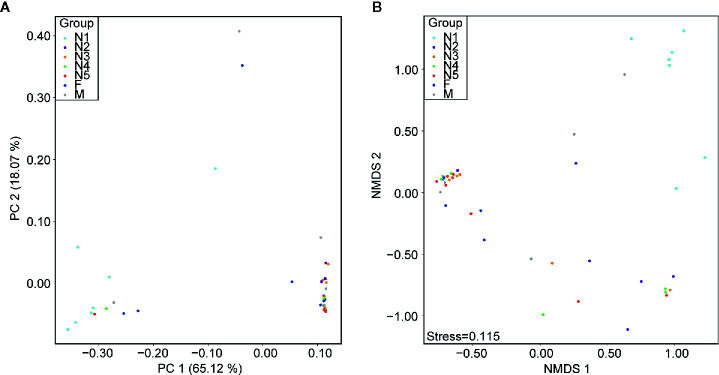
Figure 2.
Beta diversity differences in T. rubrofasciata gut samples across developmental stages on the basis of 16S rRNA gene sequencing (N1, 1st stage nymphs; N2, 2nd stage nymphs; N3, 3rd stage nymphs; N4, 4th stage nymphs; N5, 5th stage nymphs; F, female adult; M, male adult). Each point represents an individual. (A) Principal coordinate analysis (PCoA) plot of weighted UniFrac distances. (B) Nonmetric multidimensional scaling (NMDS) plot of Bray-Curtis distance.

