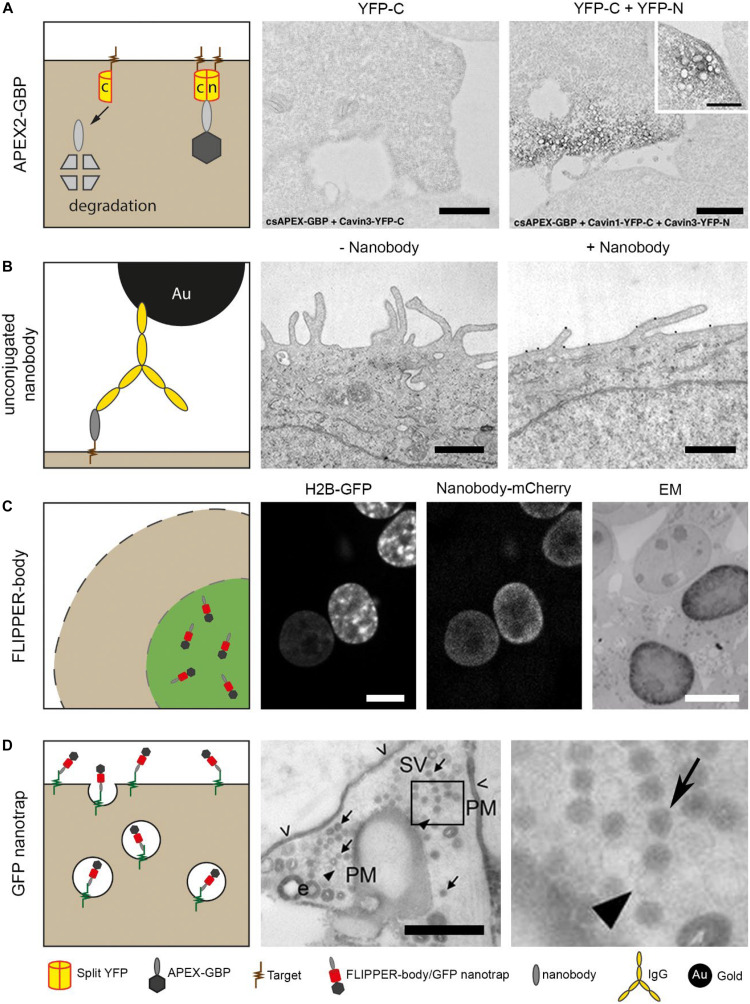
FIGURE 3.
Nanobody technology for EM. (A) Cells were expressing only C-terminus YFP or both C- and N-terminus YFP. The cells also expressed a conditionally stable anti-YFP, for proteasomal degradation of unbound probe. The nanobodies were genetically fused with peroxidase, APEX2, for EM detection. Note that only black precipitation is visible in cells expressing C-terminus YFP and N-terminus YFP. This confirmed the degradation of the nanobody with the peroxidase. Bars: 1 μm. (B) Purified nanobodies were used as primary antigen binding protein to reduce the distance between label and antigen. Nanobodies can be detected using an anti-VhH IgG conjugated to gold for EM visualization. Bars: 0.5 μm. (C) Cells express H2B-GFP from Figure 1A, and are permeabilized after fixation followed by labeling with anti-GFP FLIPPER-bodies. Note the colocalization in LM and the dark, positive nucleus in EM versus an unlabeled nucleus. Bars: 10 μm. (D) Neuronal cells expressing pHluorin on the plasma membrane. Added anti-GFP nanobodies bind to the pHluorin, and after a pulse stimulation, synaptic vesicles are formed. In EM, a population of unlabeled and labeled synaptic vesicles is detected. Arrows indicate synaptic vesicles, arrow heads indicate unstained vesicles and open arrow heads indicate residual staining (PM, plasma membrane, SV, Synaptic vesicle). Bar: 0.5 μm. The images in (A–D) have been reproduced from the following studies (Joensuu et al., 2016; Kijanka et al., 2017; Ariotti et al., 2018; De Beer et al., 2018), all of which have been published under a Creative Commons Attribution License.

