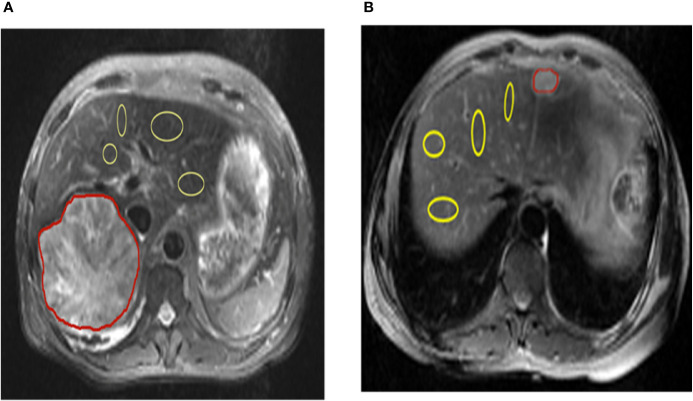
Figure 1.
Representation of regions of interest (ROIs). The T2 image shows the position of ROIs in the liver parenchyma in the tumor and tumor-adjacent normal tissue in hepatic carcinoma and hepatic hemangioma, respectively (red lines represent tumor areas, and yellow lines represent non-tumor areas). CEST, chemical exchange saturation transfer.

