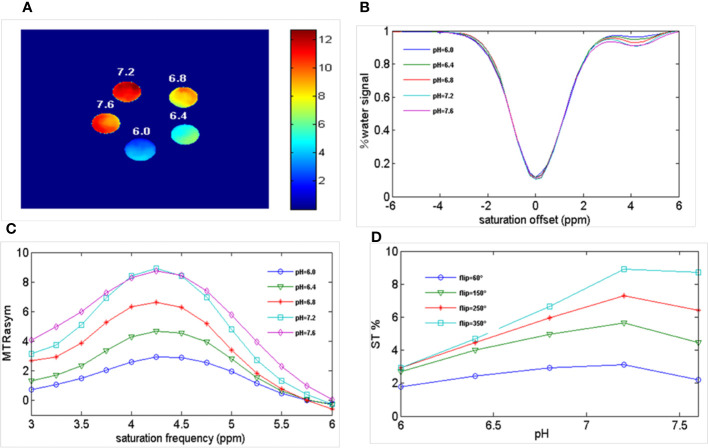
Figure 2.
Ioversol exhibits a strong CEST signal. (A) CEST map of five different pH phantoms with a flip angle of 350°. (B) Z-spectra of 50 mM ioversol at different pH values (6.0, 6.4, 6.8, 7.2, 7.6) with a flip angle of 350°. (C) MTRasym curves of 5 different pH ioversol phantoms measured with a flip angle of 350°. (D) ST% based on of different pH phantoms with different flip angles. CEST, chemical exchange saturation transfer; MTRasym, asymmetric magnetization transfer ratio; ST%, saturation transfer effect.

