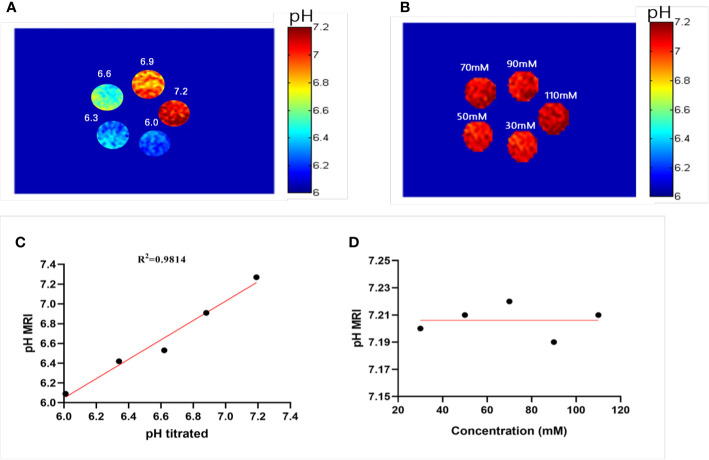
Figure 4.
Experimental pH measurements in phantoms. (A) The pH map of 50 mM ioversol at pH 6.0, 6.3, 6.6, 6.9, and 7.2, determined using ST images at flip angles of 60 and 350°. (B) pH map of ioversol at different concentrations (30, 50, 70, 90, and 110 mM), determined using ST images at flip angles of 60 and 350°. (C) The pH values determined herein correlated with the titrated pH values. (D) Mean pH values determined for several concentrations. ST, saturation transfer.

