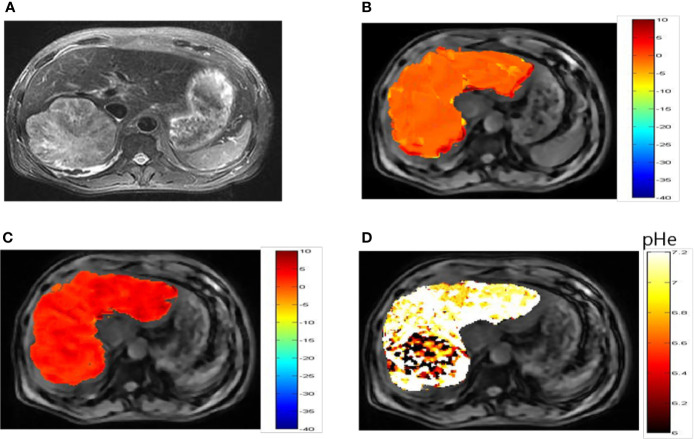
Figure 5.
pHe values of hepatic carcinoma using dual-power CEST MRI. (A) A representative image of a patient with hepatic carcinoma. (B, C) are CEST maps of hepatic carcinoma at flip angles of 60 and 350°. (D) pHe map for the tumor volume. The CEST signal for the tumor area differed from the corresponding color of the adjacent normal liver tissue, with a lower pHe value in the tumor area than in normal tissue. CEST, chemical exchange saturation transfer; pHe, extracellular pH; MRI, magnetic resonance imaging.

