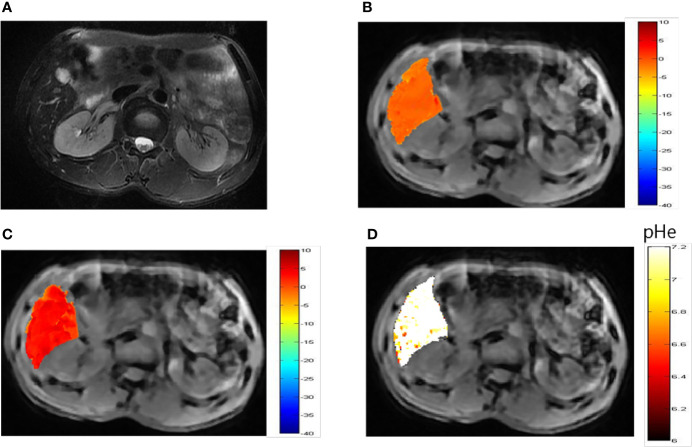
Figure 6.
pHe values of hepatic hemangioma using dual-power CEST MRI. (A) A representative image of a patient with hepatic hemangioma. CEST image after ioverol injection at flip angles of 60° (B) and 350° (C). (D) pHe map for hepatic hemangioma; the CEST pHe was consistent with the surrounding liver tissue, confirming the hemangioma to be benign.

