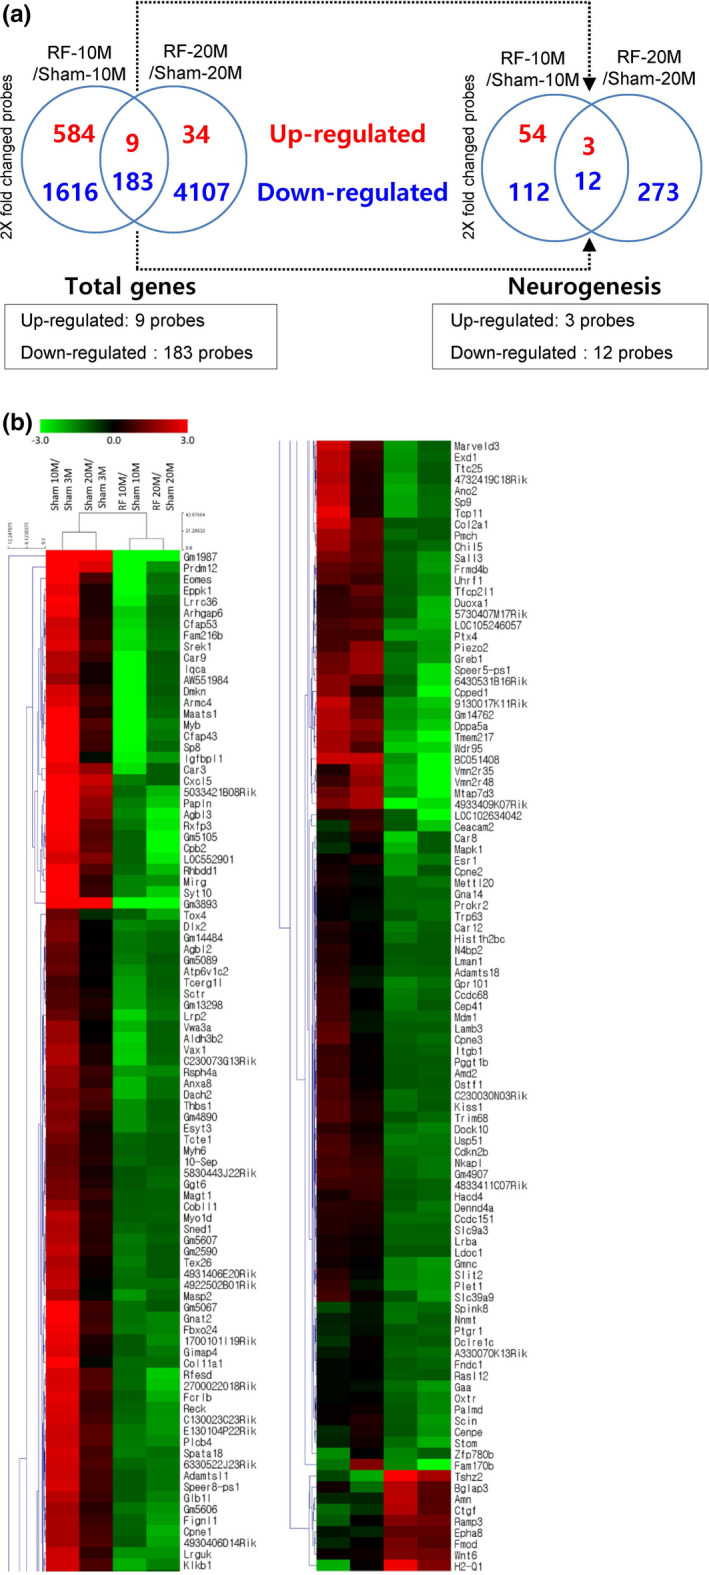
FIGURE 4.

Differentially expressed genes after chronic RF‐EMF exposure. (a) Venn diagrams for 8‐month RF‐EMF exposure showing genes that were up‐ or downregulated in both 10M (months) and 20M groups. (b) Heat map of genes differentially expressed between the sham‐ and RF‐EMF‐exposed mice groups. RF; RF‐EMF
