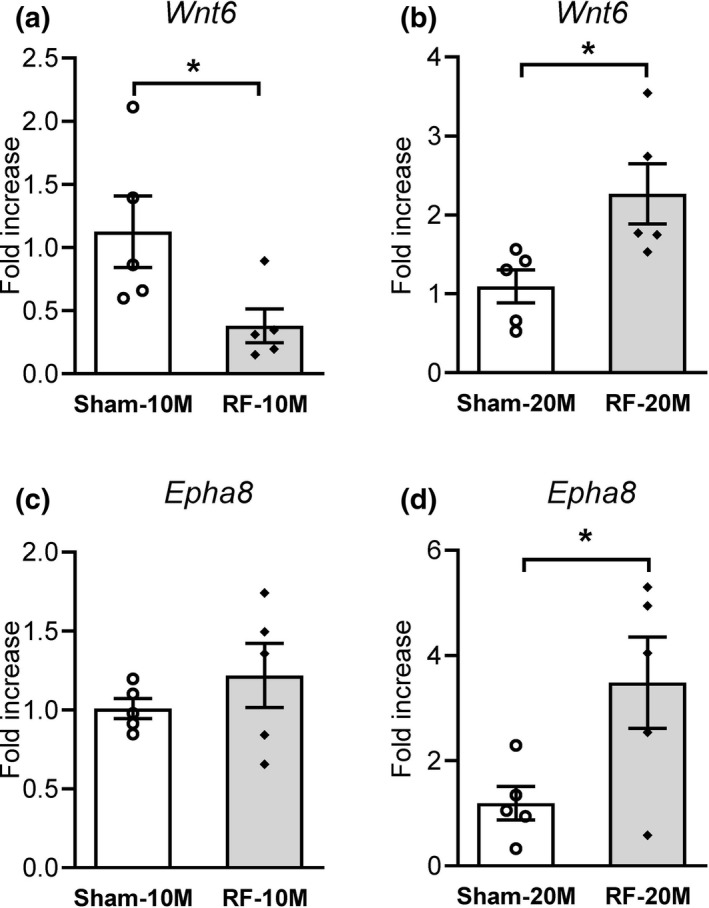
FIGURE 6.

Changes in Wnt6 and Epha8 levels in the mouse hippocampus after chronic RF‐EMF. The bar graphs show the levels of mRNA encoding Wnt6 in the hippocampi of 10M (months) (a) and 20M (b) mice, respectively. The mRNA levels of Epha8 were evaluated in the mice hippocampi of 10M (c) and 20M (d) mice. All data are reported as mean ± SEM (n = 5 per group). Statistical significance has been defined as *p < .05 Sham versus RF group
