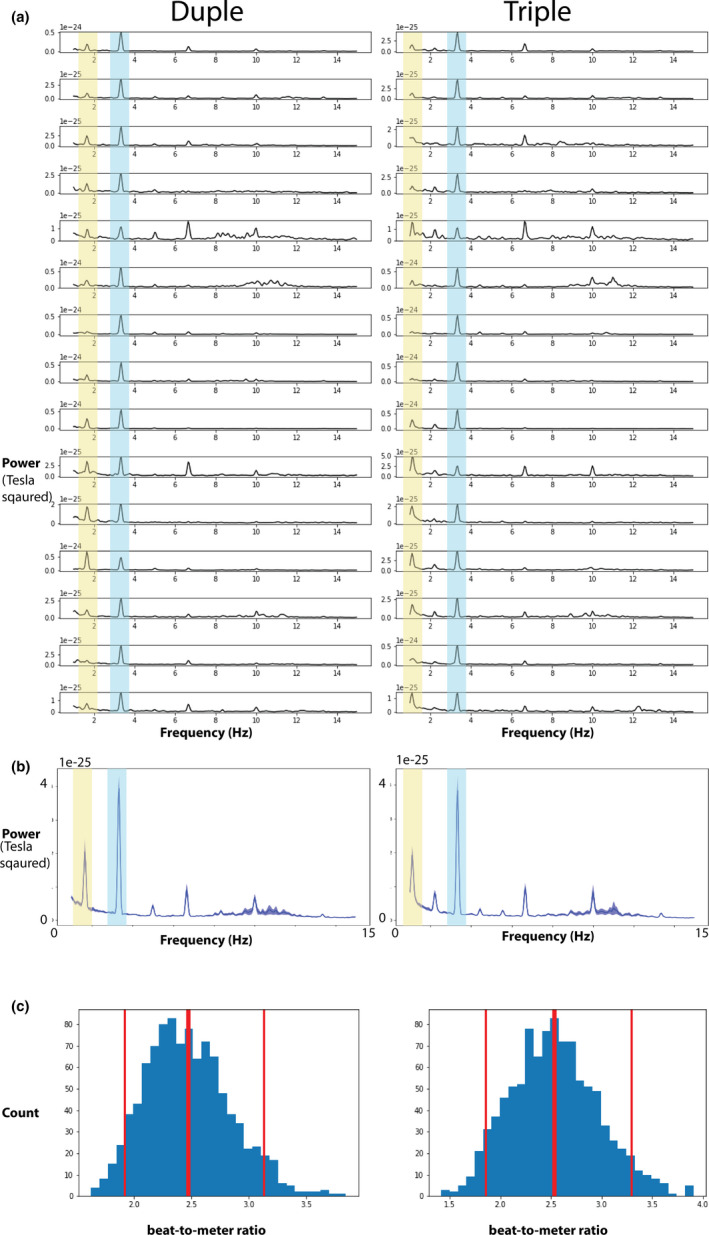
Figure 3.

(a) Individual power spectrum density for duple (left) and triple (right) conditions. Blue shaded peak corresponds to beat‐level rhythm, and yellow shaded peak corresponds to meter‐level rhythm. (b) Group average power spectrum density for duple (left) and triple (right) conditions. (c) Bootstrap distributions of beat‐to‐meter ratios over 1,000 simulations for duple (left) and triple (right) conditions. Mean of distribution (center red vertical line) and 95% confidence interval (left and right red vertical lines) are marked shown
