FIGURE 4.

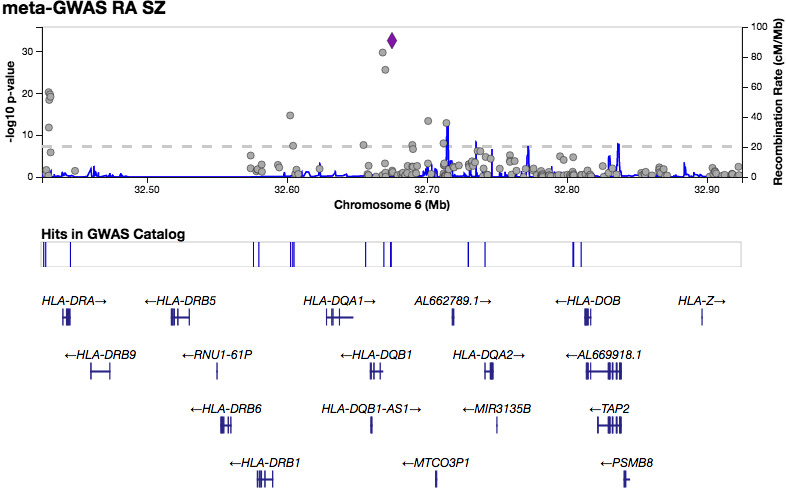
LocusZoom plot showing the most significant associated region within the MHC region on chromes 6 in RA‐schizophrenia meta‐GWAS dataset.

LocusZoom plot showing the most significant associated region within the MHC region on chromes 6 in RA‐schizophrenia meta‐GWAS dataset.