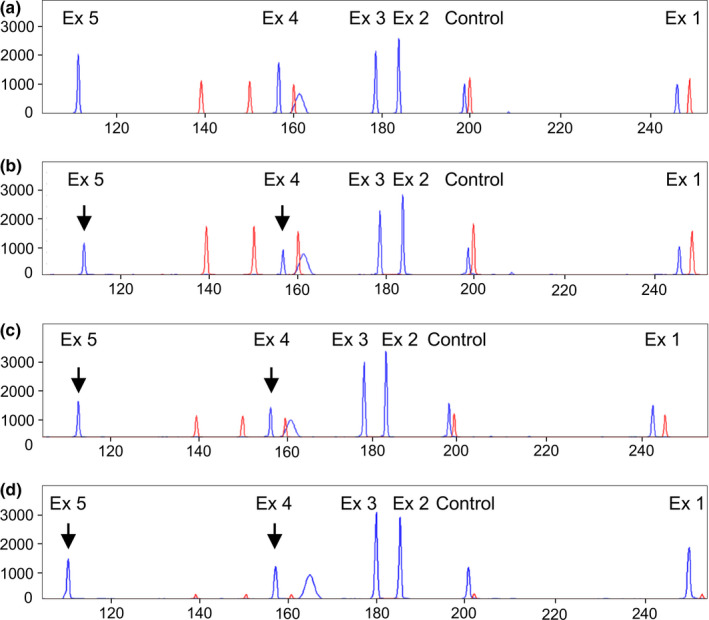
FIGURE 2.

Detection of the CLDN16 deletion using a QMPSF assay. Panels show the QMPSF electropherograms of: (a) normal control, (b) proband, (c) brother, and (d) father. Blue peaks and red peaks correspond to CLDN16 exons 1–5 fragments and molecular weight markers, respectively. The Y‐axis indicates fluorescence in arbitrary units, and the X‐axis displays the size in base pairs. The heterozygous deletion is easily detected by a reduction of the peaks corresponding to exons 4 and 5 (arrows) in the proband, his brother and father compared to a normal control
