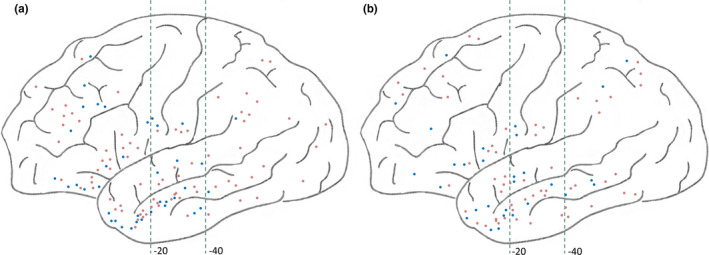
Figure 1.

Lateral view of SEEG implantation in the version (+) (a) and (−) (b) groups. The blue dots correspond to the right‐sided electrodes, and the orange dots correspond to the left‐sided electrodes. The green dashed line represents the y‐axis of the MNI coordinates at −20 and −40
