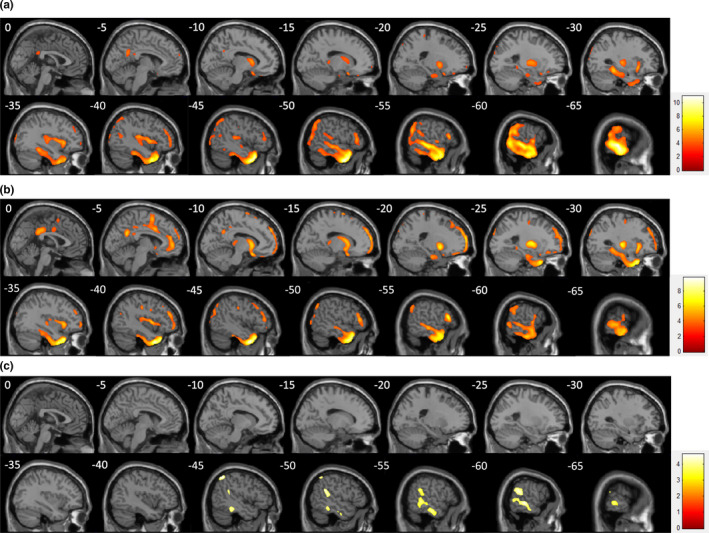
Figure 2.

Statistical parametric mapping analysis between patients with ictal head version and controls (a), between patients without head version and controls (b), and the intergroup comparison (c). Compared with the controls, both version (+) and (−) showed extensive hypometabolism. Compared with the version (−) group, in the version (+) group, the regions with more hypometabolism included the MTN and PTN, SMG and IPL, according to the AAL atlas
