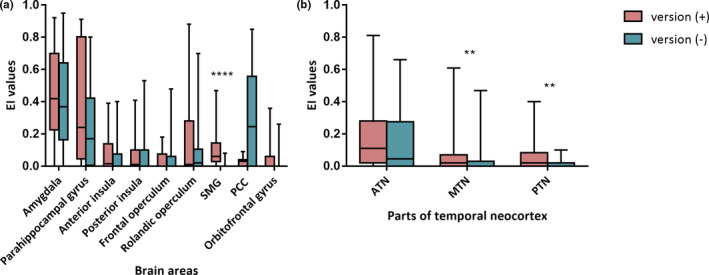
Figure 3.

Boxplot of the EI values among seizures in each group and diverse ROIs. (a) Comparison of EI values between groups in the brain areas outside the temporal neocortex. The SMG is a unique ROI that showed a significant difference. (b) (a) Comparison of EI values between groups in the ATN, MTN, and PTN. The EI values in the MTN and PTN were higher in the version (+) group than in the version (−) group. **p < .01; ****p < .0001
