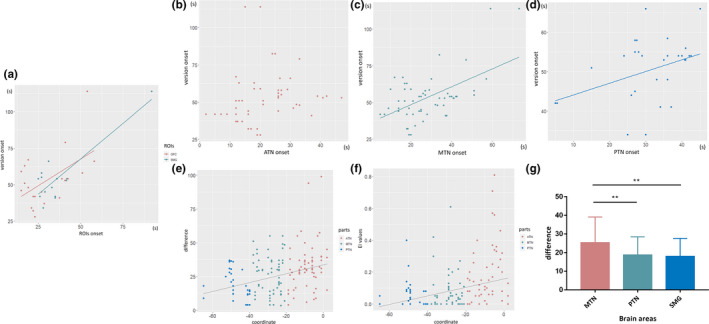
Figure 4.

(a) A linear correlation was found between the version onset time and the onset times in the following ROIs: OFC and SMG. The relationship between onset times of version and the temporal neocortex is shown in (b–d). Correlations were observed in the MTN and PTN. A linear relationship was observed between EI (e) and the difference from version onset to temporal neocortex onset (f) and the y‐axis of the MNI coordinate. (g) Histograms of differences observed in the MTN, PTN, and SMG. The difference in the MTN was significantly higher than that observed in the PTN and SMG. **p < .01
