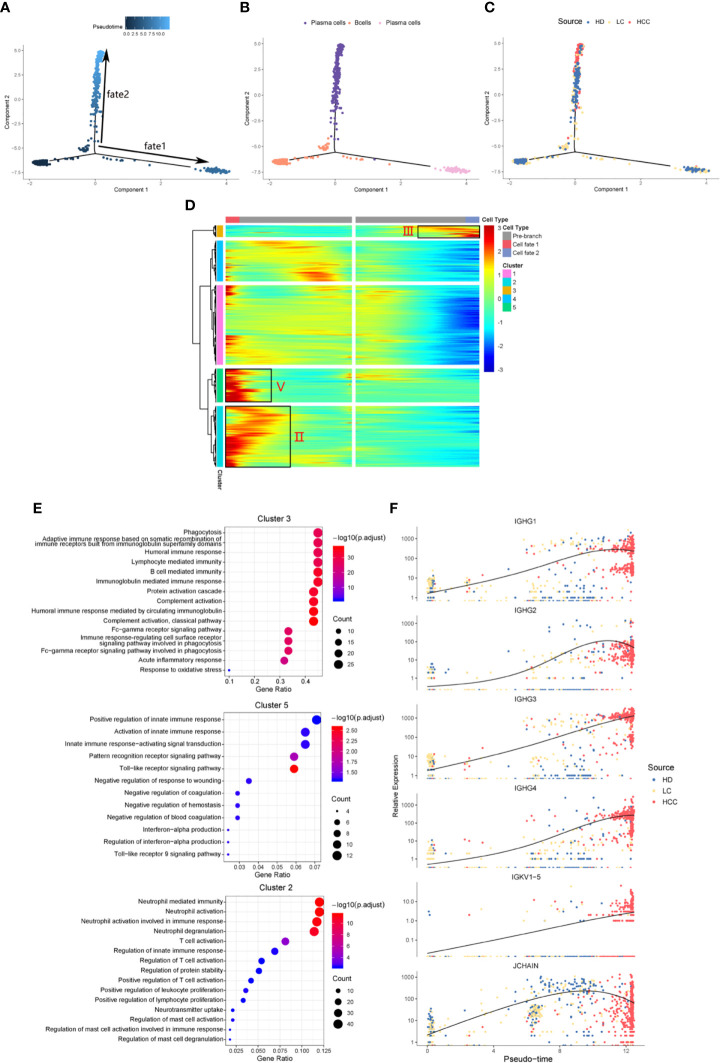
Figure 3.
Simulation of the development trajectory of B cells and the analysis of gene expression pattern. Simulation of the differentiation trajectory of B cells group from three sources, healthy donors (HD), patients with liver cirrhosis (LC), and patients with hepatocellular carcinoma (HCC), (A) pseudo-trajectory of B cells, (B) cell type transition, (C) cell source transition. (D) Heatmap shows the gene expression dynamics of B cell group. Genes (rows) are clustered and cells (columns) are ordered according to the pseudotime development. Genes are listed in Table S2 . Gene clusters III, V, and II were selected for further analysis. (E) The GO function enrichment analysis results of gene cluster III, V and II of B cell group, p.adjust < 0.01. (The first 12 GO terms are retained). (F) Expression patterns of some genes enriched in humoral immunity under three sources.

