letter
. 2020 Nov 2;16(6):1432–1439. doi: 10.5114/aoms.2020.100304

Table I.

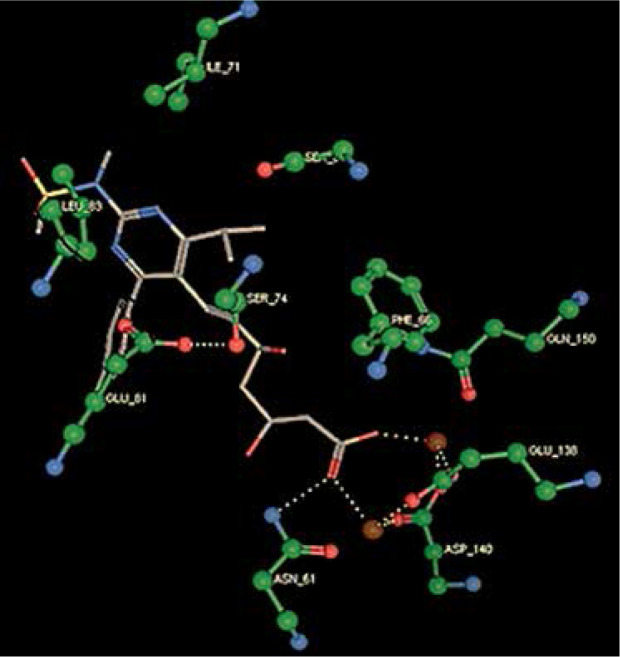
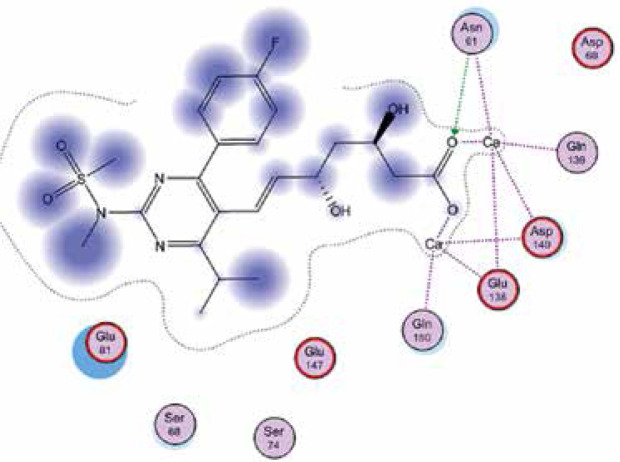
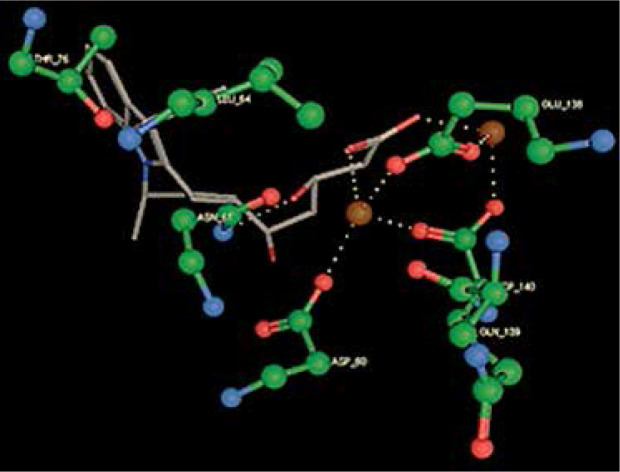
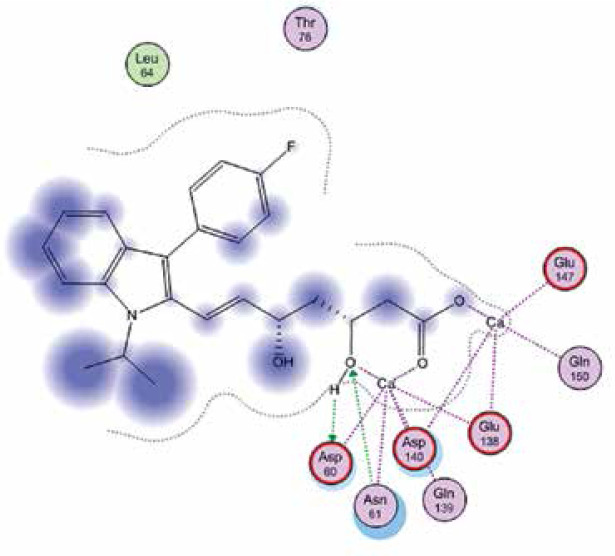
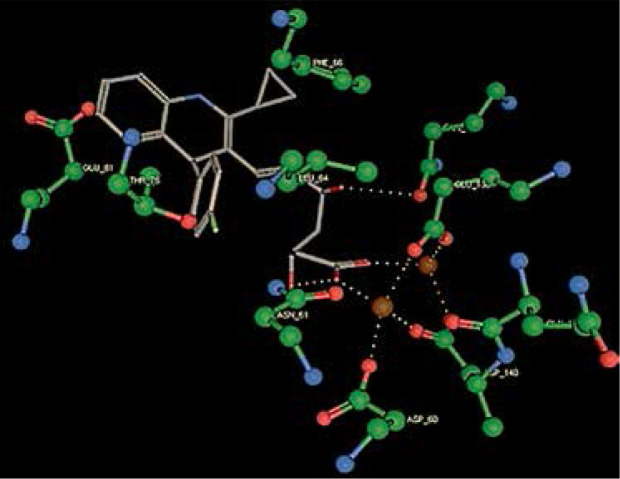
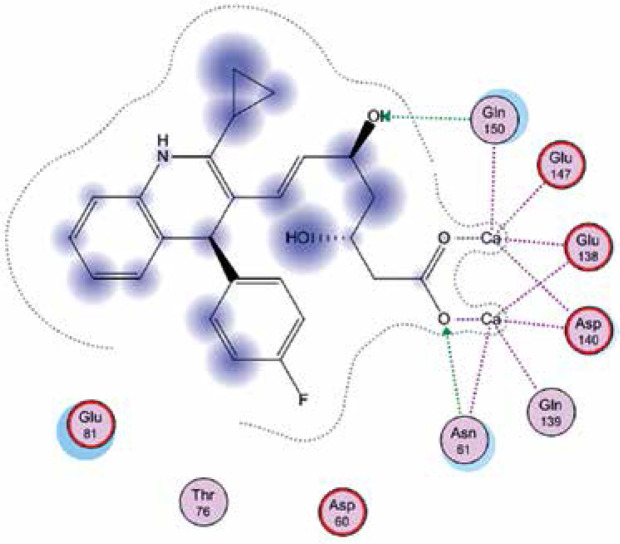
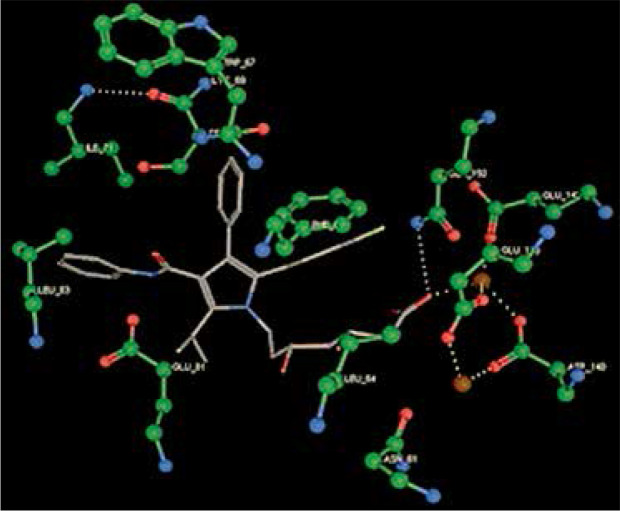
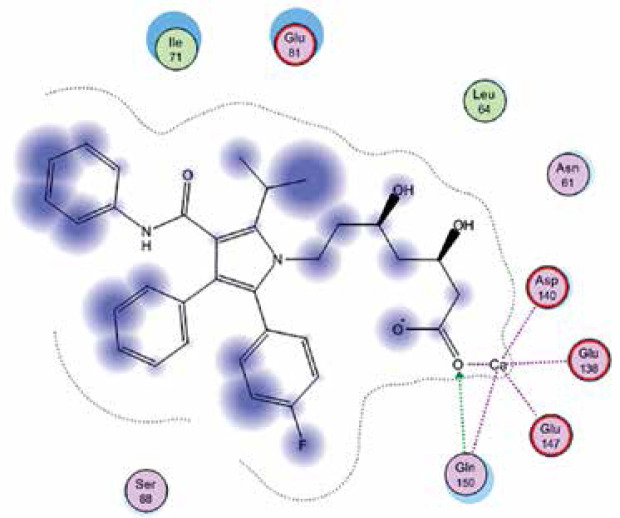
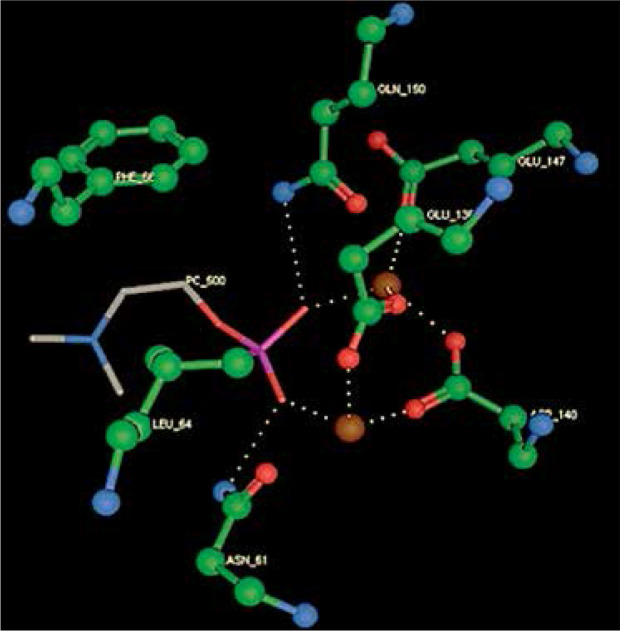
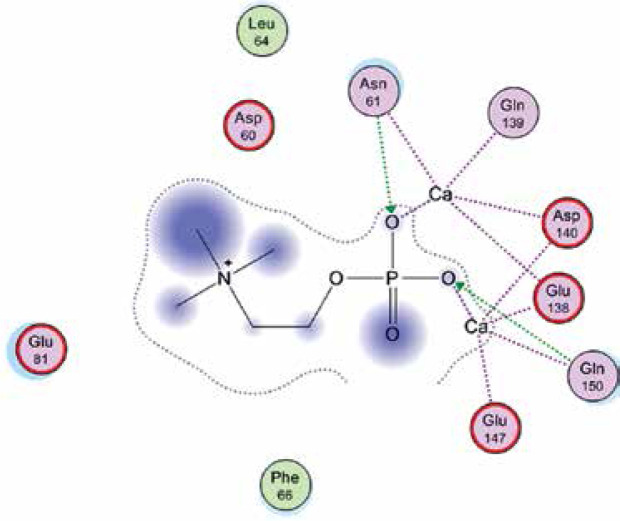
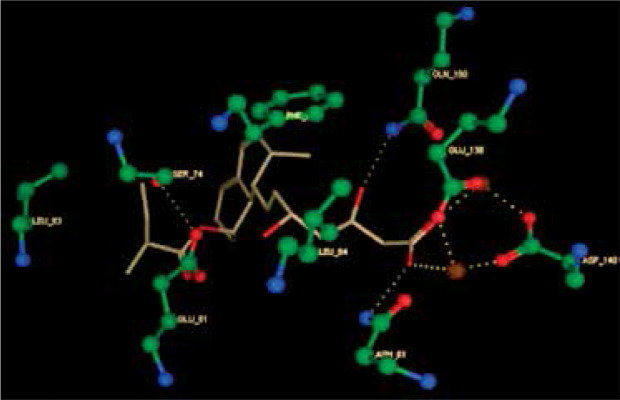
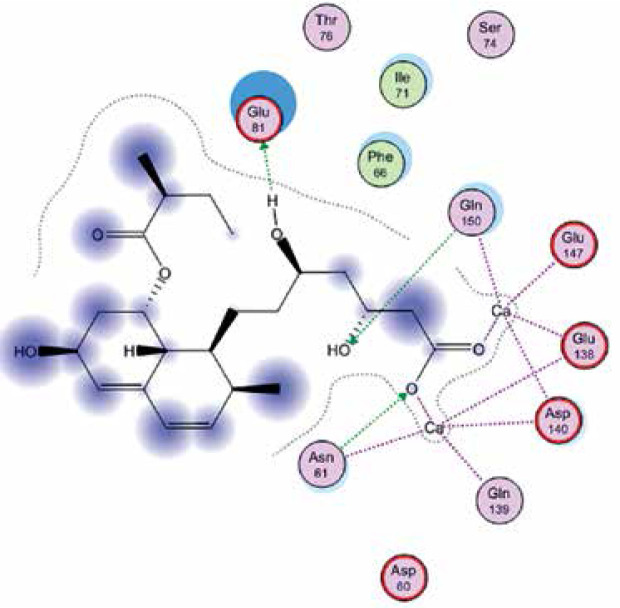
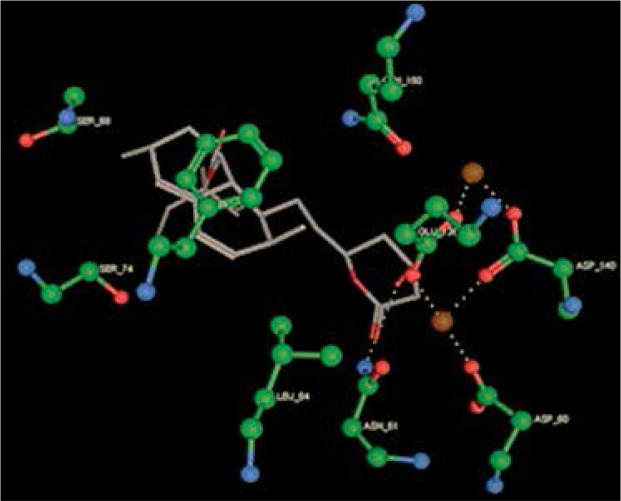
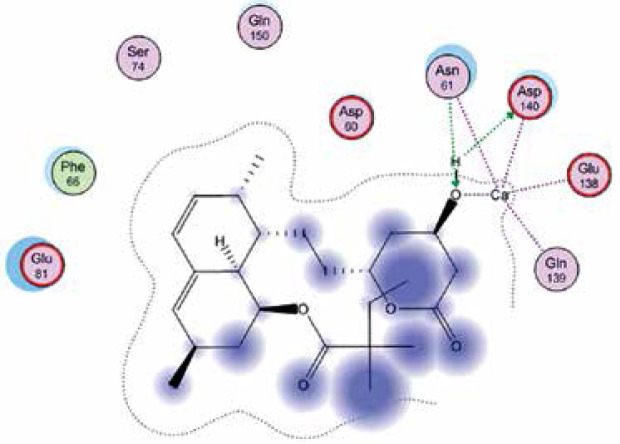
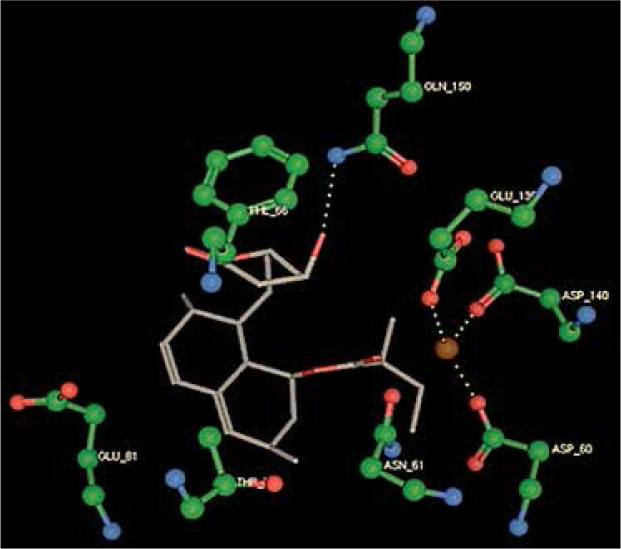
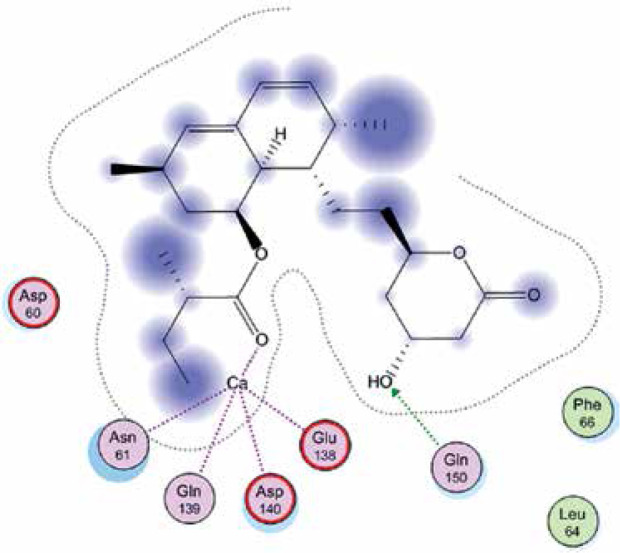
Right column – 3D-docking of phosphorylcholine and respective ligands with the CRP molecular target, Ca2+ (brown) is seen at the center. Left column – Docking of CRP with a-h compounds in 2D diagram. A – rosuvastatin, B – fluvastatin, C – pitavastatin, D – atorvastatin, E – phosphorylcholine, F – pravastatin, G – simvastatin, H – lovastatin

Ligands Docking 3D representation Docking 2D representation
(A) graphic file with name AMS-16-6-42213-i001.jpg graphic file with name AMS-16-6-42213-i002.jpg
(B) graphic file with name AMS-16-6-42213-i003.jpg graphic file with name AMS-16-6-42213-i004.jpg
(C) graphic file with name AMS-16-6-42213-i005.jpg graphic file with name AMS-16-6-42213-i006.jpg
(D) graphic file with name AMS-16-6-42213-i007.jpg graphic file with name AMS-16-6-42213-i008.jpg
(E) graphic file with name AMS-16-6-42213-i009.jpg graphic file with name AMS-16-6-42213-i010.jpg
(F) graphic file with name AMS-16-6-42213-i011.jpg graphic file with name AMS-16-6-42213-i012.jpg
(G) graphic file with name AMS-16-6-42213-i013.jpg graphic file with name AMS-16-6-42213-i014.jpg
(H) graphic file with name AMS-16-6-42213-i015.jpg graphic file with name AMS-16-6-42213-i016.jpg
graphic file with name AMS-16-6-42213-i017.jpg