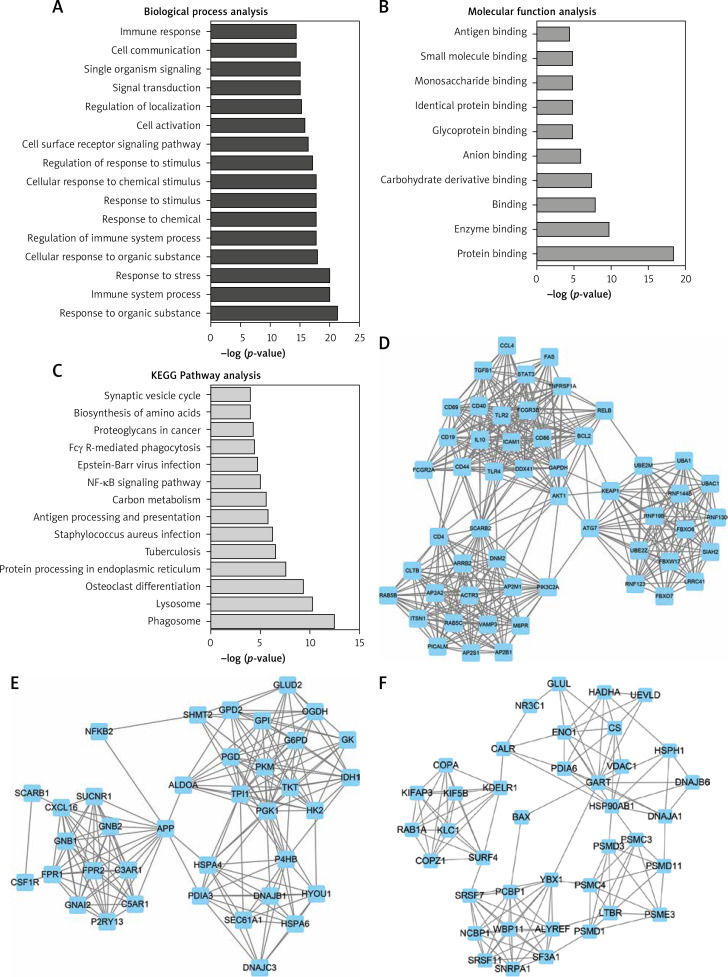
Figure 3.
GO and KEGG analysis of differentially expressed lncRNAs in HL. (A–B) GO analysis shows differentially expressed lncRNA-related biological process analysis (A) and molecular function analysis (B). C – KEGG pathway analysis reveals differentially expressed lncRNA-related KEGG pathway analysis. D – Hub-network 1 contained 53 nodes and 458 edges. E – Hub-network 2 contained 37 nodes and 188 edges. F – Hub-network 3 contained 39 nodes and 135 edges

